

Premium Content available below
The Decision Brief
Fragmented multi-protocol operational technology imposes an 8X cost penalty on enterprise building portfolios and paralyzes risk-adjusted capital allocation. Enterprise Real Estate Capital Stewards surrender $100,179,780 in direct operational drag and abandon $1,003,325,400 in capital deployment pipelines annually due to manual cross-site evaluation latency. Incumbent industrial conglomerates pitch cloud-hosted software-as-a-service (SaaS) overlays and conversational artificial intelligence (AI) copilots that leave underlying protocol silos intact. These sustaining patches protect regional branch labor revenues while multiplying operational alarm fatigue.
The empirical reality of enterprise portfolio management requires a sharp distinction between verified physics and vendor assumptions:
FACT: Evaluating capital risk across multi-vendor facilities costs $1,005.84 per execution manually versus a physics-floor cost of $127.07, driving an 87.3% efficiency penalty across 114,000 annual global reviews.
FACT: Software-as-a-service copilot overlays trigger a super-linear alert volume that bottlenecks at linear human field engineering workflows.
ASSUMPTION: Enterprise real estate transaction pipelines will maintain a 35% abandonment rate if data ingestion latency remains at 3.2 hours per query.
HUNCH: Legacy original equipment manufacturers (OEMs) will resist native open-protocol normalization to prevent the commoditization of billable field engineering hours.
Enterprise buyers must halt all capital allocations for supervisory AI overlays, generative copilot wrappers, and centralized cloud dashboards. Fiduciary capital should be directed exclusively toward a federated, read-only semantic translation layer that harmonizes telemetry schemas at the edge before committing to any autonomous control plane.
The Proof in the Field
During Week 2 of an empirical enterprise facility pilot across five multi-tenant commercial assets, three distinct mechanical anomalies developed concurrently. Building 1 registered an 18% surge in chiller kilowatt-hour consumption. Building 2 logged a 12% increase in cooling tower runtime. Building 3 experienced a 3°F compression in condenser water delta-T.
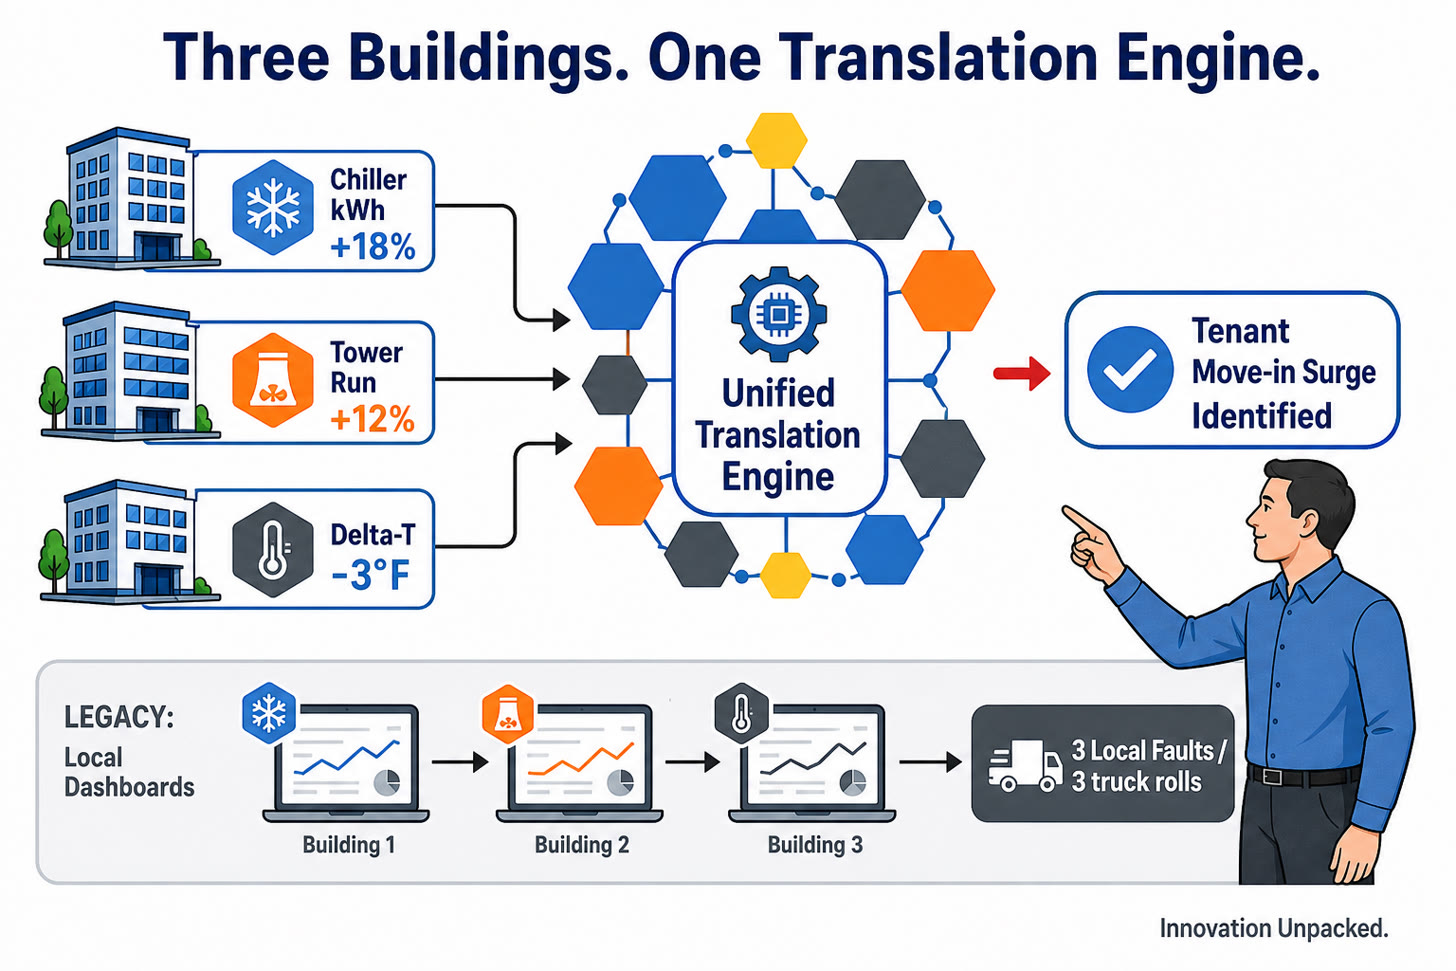
Each facility operated under an independent building management system (BMS) supervisory platform, including Siemens Desigo CC and legacy field controllers. Each independent system classified its respective telemetry change as a local equipment fault, queuing three separate truck rolls for mechanical field inspection.
A unified semantic translation engine correlated the time-series telemetry across the properties, revealing that the deviations were not mechanical failures. The cross-building pattern was driven by an unannounced, synchronized occupancy surge resulting from simultaneous corporate tenant move-ins. No single facility manager or localized BMS could observe this correlation because 42% of point names across vendor data tables in the same facility failed to share a common naming schema.
In that same pilot, an air handling unit supply-air temperature sensor had drifted steadily since 2019. The installed cloud digital twin accepted the erroneous telemetry as baseline ground truth, modeled around the mechanical error, and displayed a green operational status while wasting conditioning energy for seven years.
ASSUMPTION: The operational penalty of uncorrected sensor drift across un-normalized commercial footprints averages $14,000 to $22,000 per air handling unit over a typical five-year equipment lifecycle.
The 8X Execution Penalty and the $1.003 Billion Pipeline Abandonment Trap
Manual capital-allocation triage across distributed building portfolios costs $1,005.84 per execution, compared to an optimized physics-floor cost of $127.07. Enterprise portfolio operators across 190 global commercial real estate jurisdictions execute an average of 600 risk-prioritization evaluations per region each year. This creates a global baseline volume of 114,000 capital-allocation reviews annually.
The manual reconciliation stack consumes $0.43 of internal engineering labor and $1,002.00 in external vendor verification, field engineering assessments, and consultant reconciliation per review.
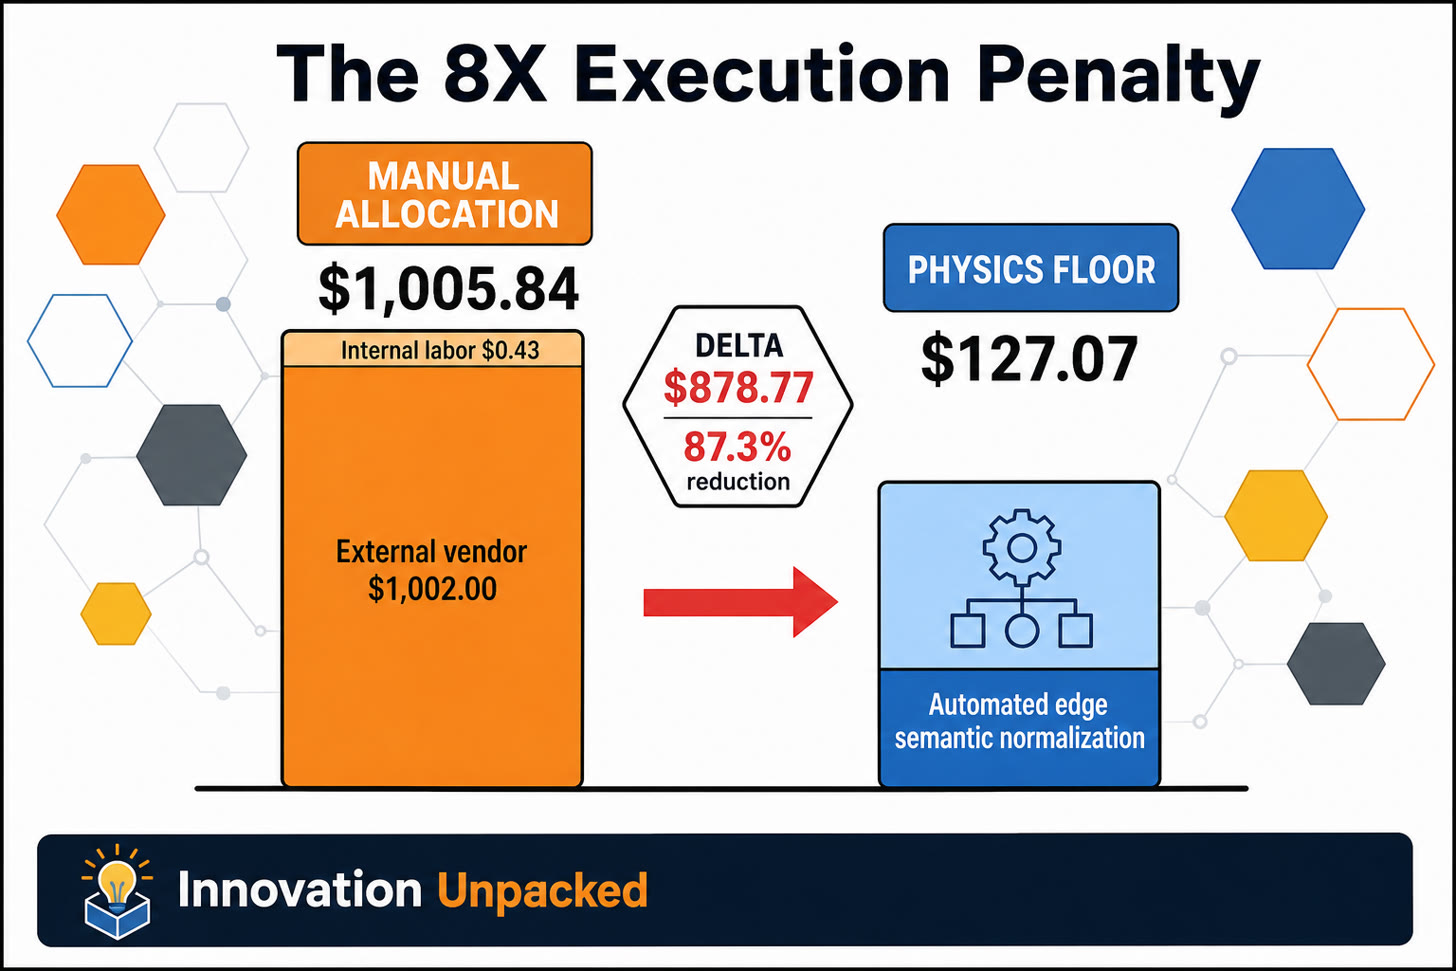
At 114,000 annual global executions, this manual drag generates $100,179,780.00 in direct operational expenditure waste.
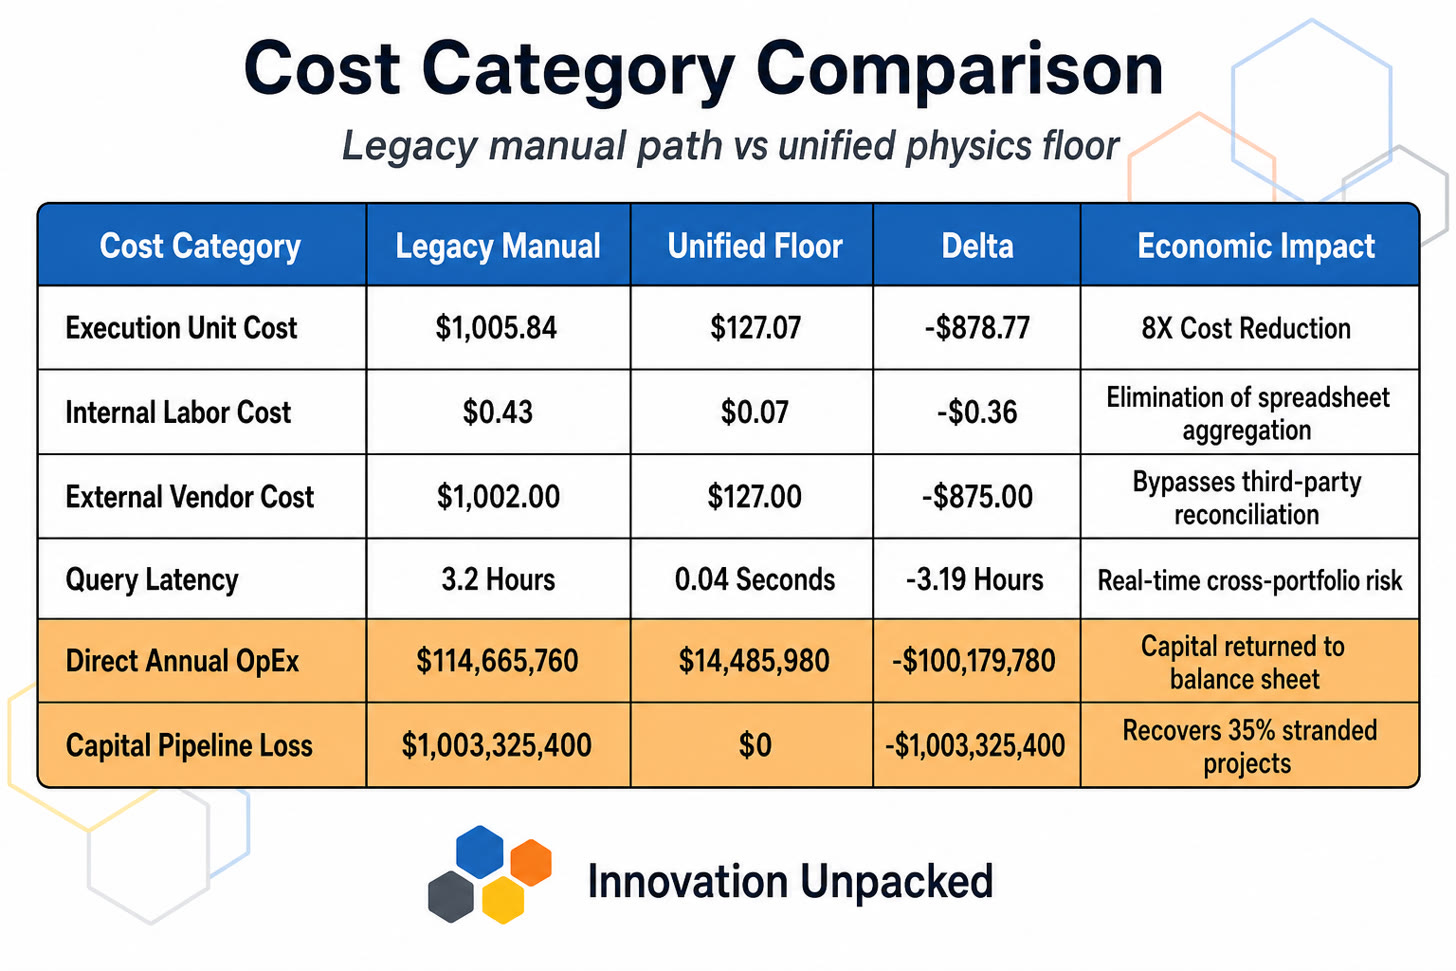
The direct operational expense penalty is dwarfed by the capital pipeline abandonment tax. Because manual cross-site data extraction requires 3.2 hours of engineering effort per forecast query, portfolio operators encounter decision latency bottlenecks during quarterly capital allocation cycles.
This latency causes a 35% abandonment rate for planned capital expenditures, facility upgrades, and retrofit transactions. Across the global enterprise footprint, this friction leaves $1,003,325,400.00 in transaction pipeline value stranded annually.
The irreducible problem is not a lack of operational visibility in the mechanical room. It is the lack of comparable visibility across heterogeneous protocol silos at the capital-allocation interface.
When a 10% platform value-capture rate is applied to the preserved transaction volume, an additional $100,332,540.00 in net enterprise value is recovered.
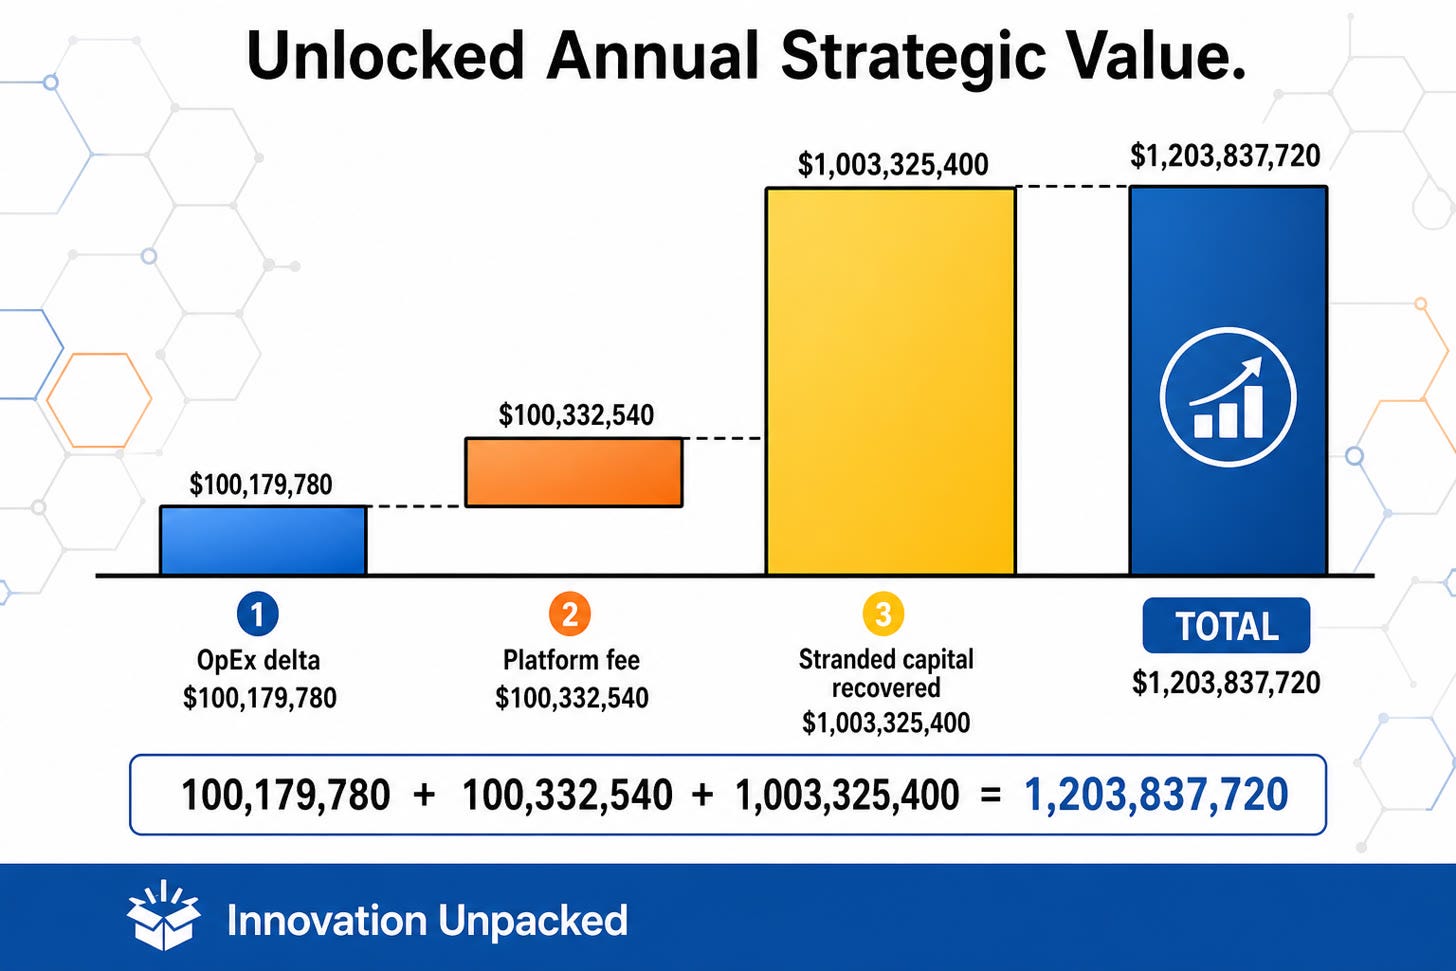
Total annual strategic value unlocked by collapsing the protocol gap reaches $1,203,837,720.
Premium Content
Can your capital committee verify that your multi-site facility telemetry is semantically comparable across all properties, or is your portfolio quietly absorbing an 8X cost penalty on every capital allocation review?
Paid subscribers have access to special content below It consists of free access this research package inside my research hub — as well a link to the interactive NotebookLM oracle. These research packages can be found at https://studio.jtbd.one/research for a one-time fee for select artifacts or an optional fee for access to all of the complete Notebook — which includes a RAG-like interface you can use to interrogate the research, and ask for answers to questions I may not have asked for you.
This section is for premium readers only. If you don’t see anything and want to, I hope you’ll subscribe
Incumbent Organizational Mechanics Protect Billable Labor Over Edge Autonomy
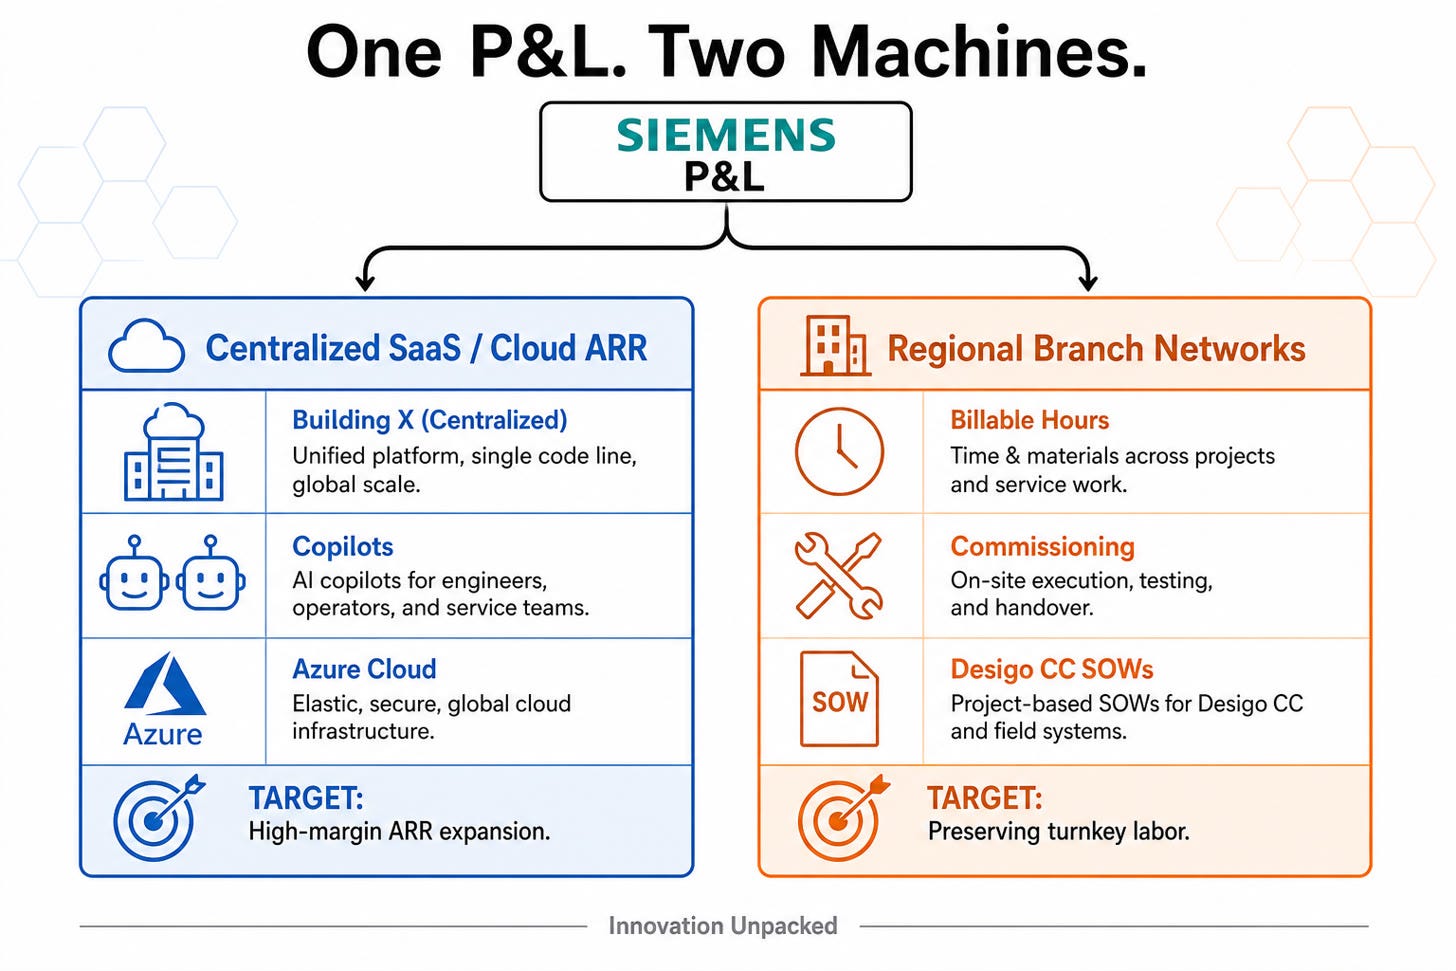
Industrial conglomerates defend legacy hardware footprints and regional service models by releasing software-as-a-service overlays that leave field controllers untouched. Siemens AG illustrates the structural mechanics of an incumbent executing a sustaining innovation roadmap.
Operating across Smart Infrastructure (25.2% of group revenue) and Digital Industries (27.6% of group revenue), Siemens generated €75.93 billion in FY 2024 and €78.91 billion in FY 2025. It generated €10.8 billion in free cash flow in FY 2025 and scaled its cloud annual recurring revenue (ARR) beyond €1.3 billion.
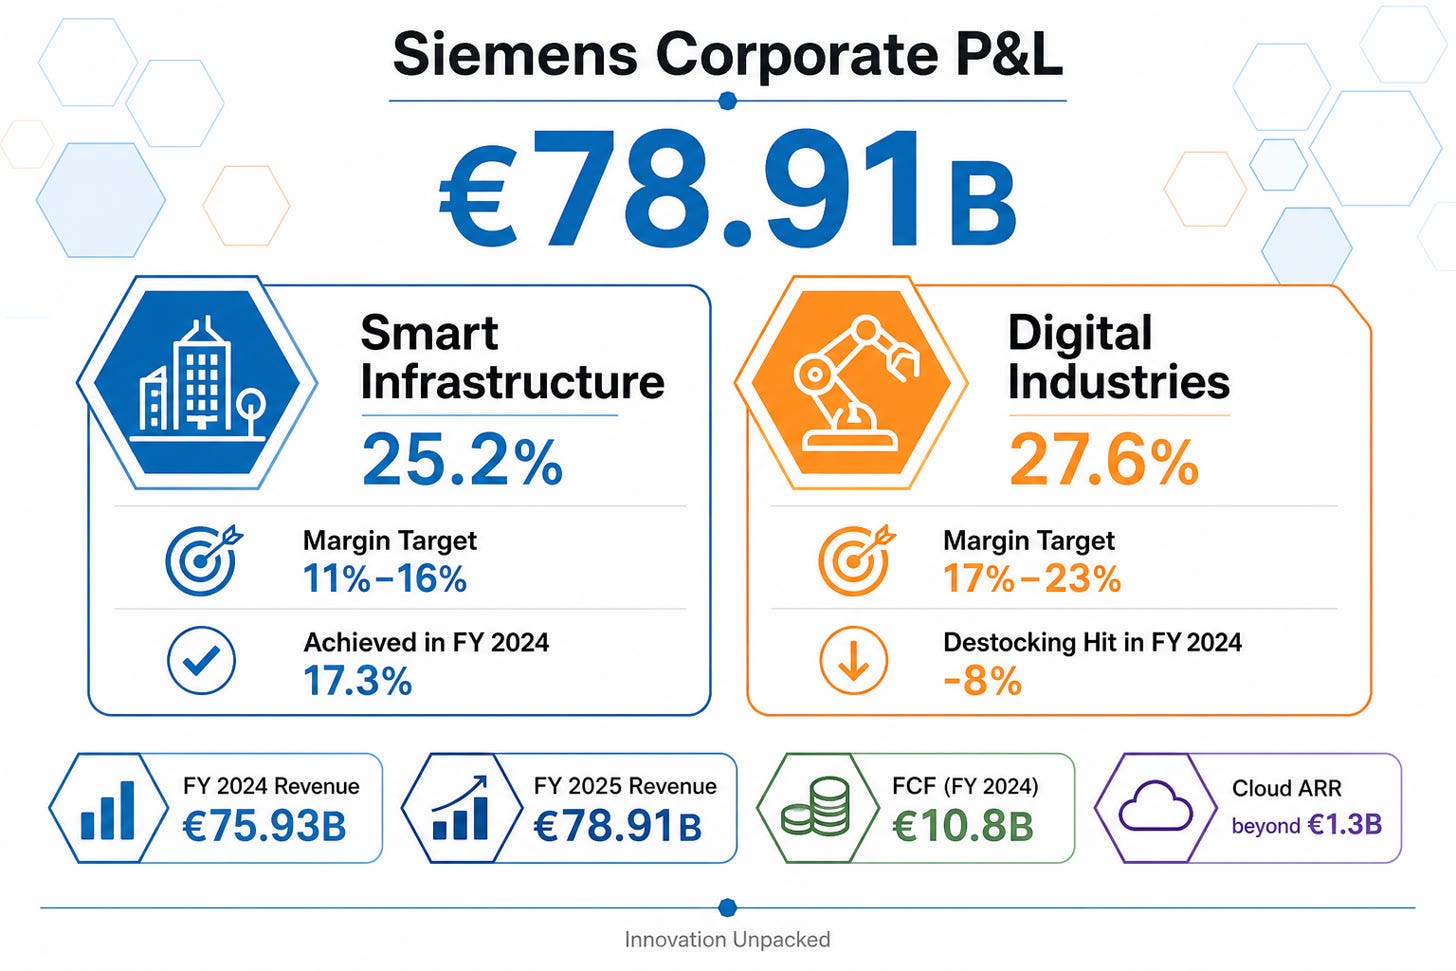
Siemens’s capital allocation enforces strict segment margin targets: 17% to 23% for Digital Industries and 11% to 16% for Smart Infrastructure (which achieved 17.3% in FY 2024). These targets govern its institutional behavior across three distinct organizational dimensions:
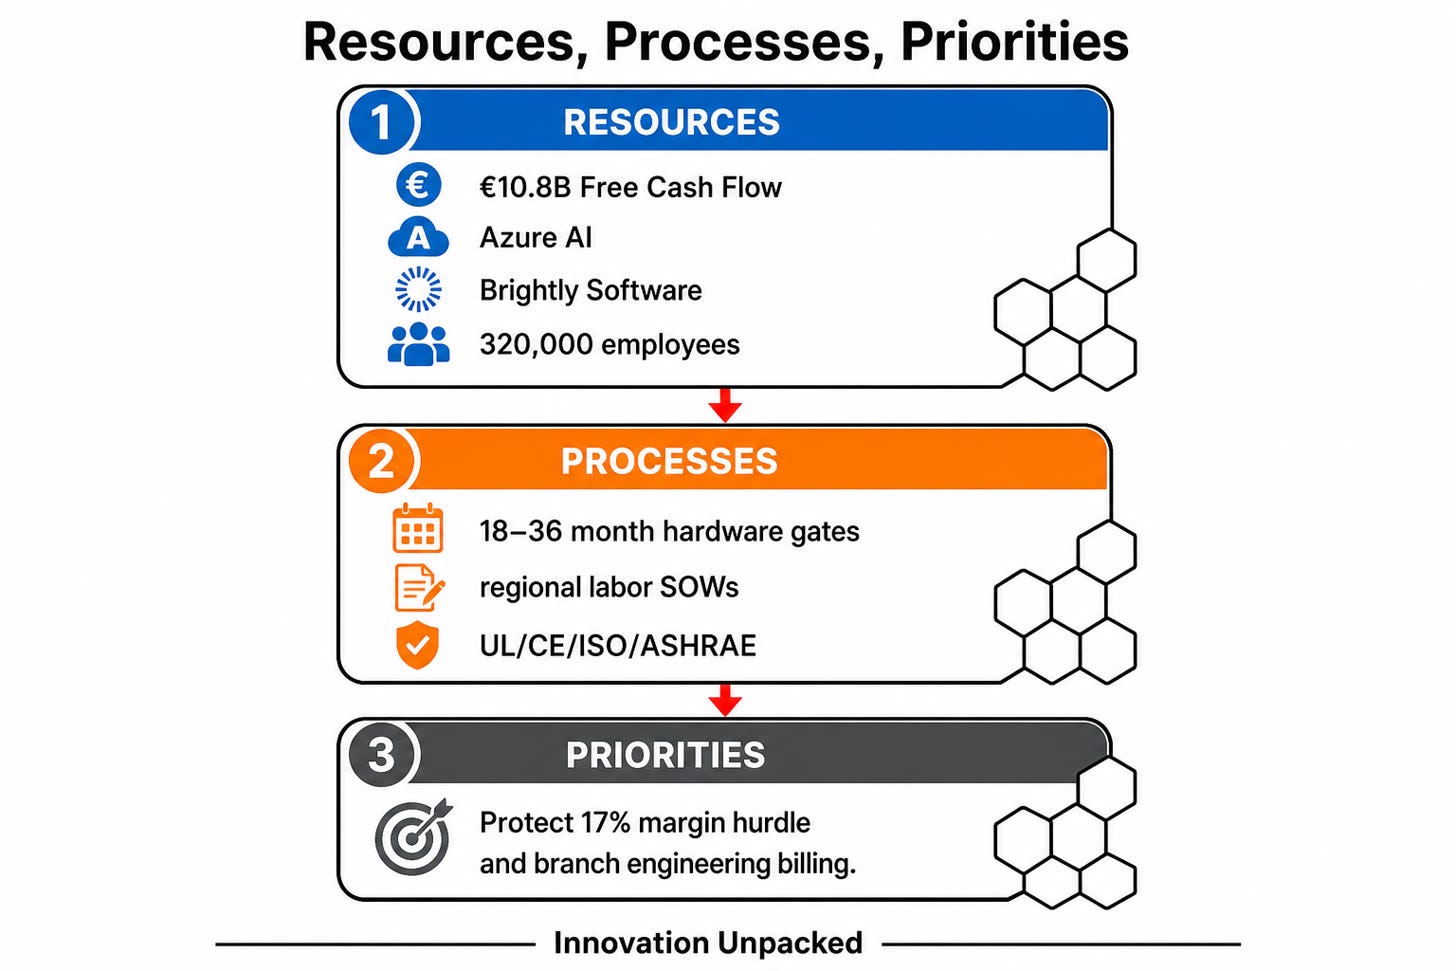
Resources: A capital reserve of €10.8 billion in free cash flow, a global workforce of 320,000 employees across 190 countries, and deep enterprise partnerships with Microsoft Azure for AI Foundry and OpenAI infrastructure.
Processes: Development cycles governed by 18-to-36-month hardware and firmware stage gates, formal life-safety compliance protocols (UL, CE, ISO, ASHRAE), and branch-level installation procedures.
Priorities: Defending division-level profit margins and preserving regional branch engineering utilization rates derived from manual configuration, graphics authoring, and point-to-point physical commissioning.
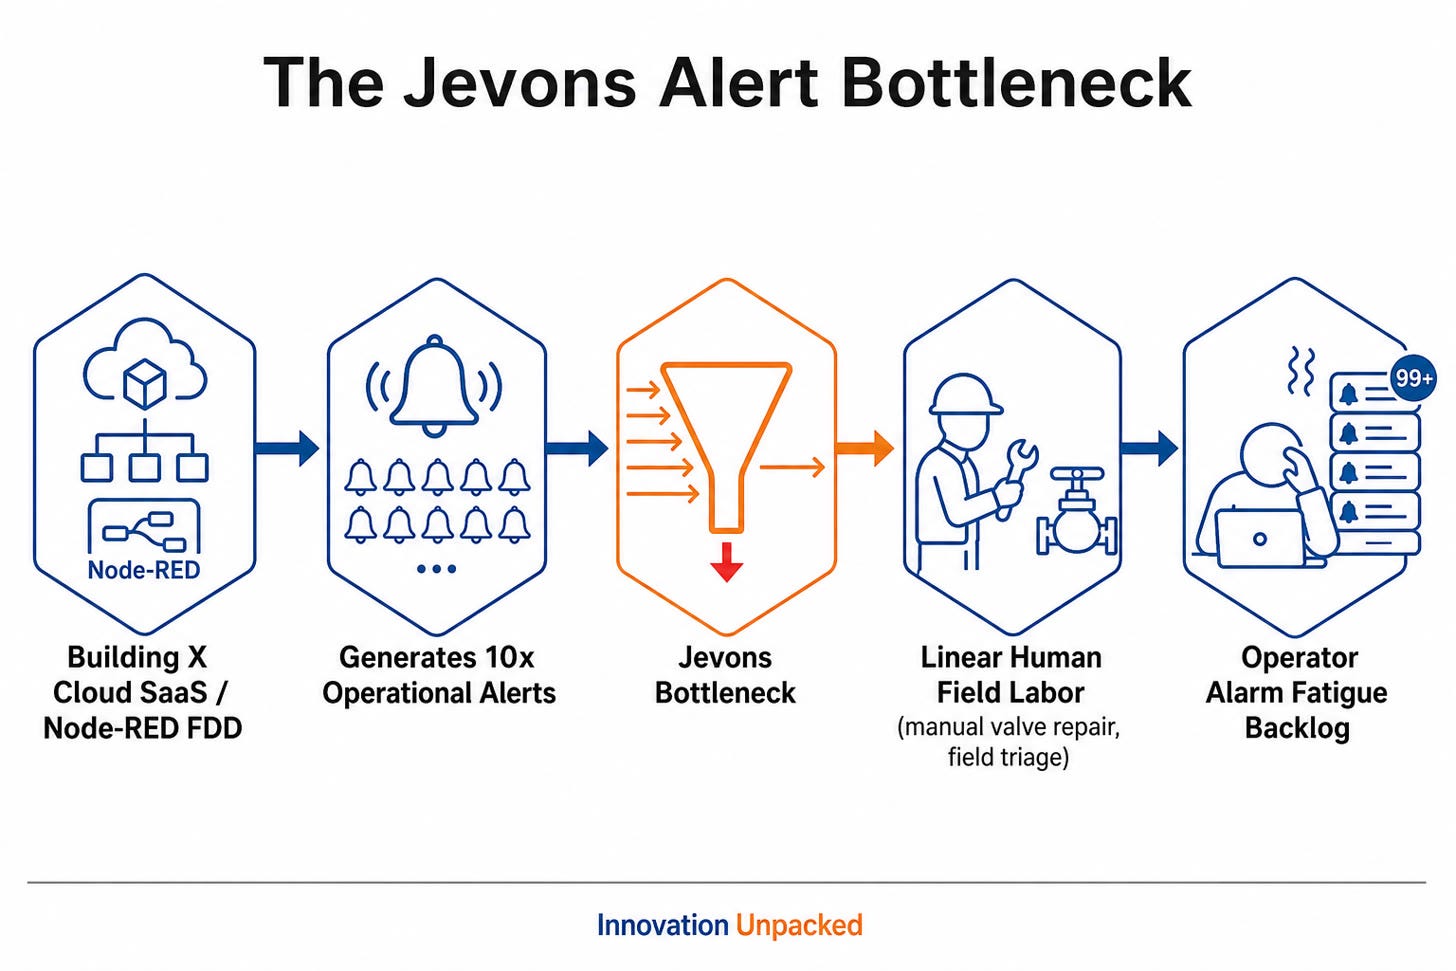
This structural alignment creates the Jevons paradox of digital diagnostics. By lowering the friction of fault detection through low-code rule engines (such as Node-RED in Building X) and generative AI copilots, incumbents dramatically increase the volume of maintenance alerts.
Because physical remediation requires manual engineering labor, diagnostic efficiency creates a linear maintenance bottleneck. Enterprise operators face compounding alarm backlogs and ticket fatigue while paying recurring software fees for insights their field teams cannot execute.
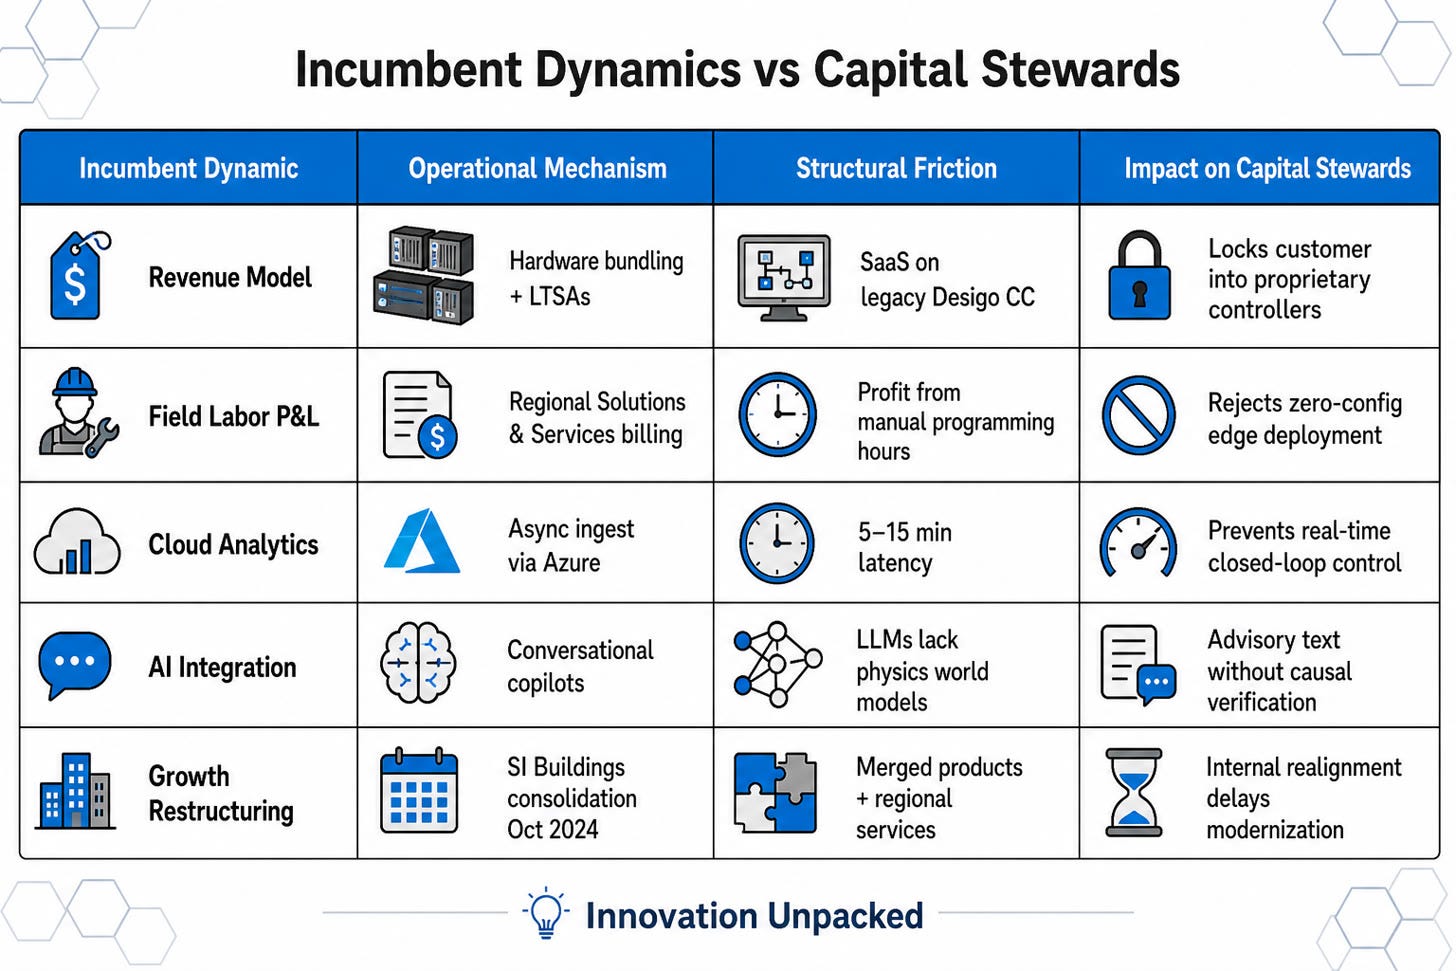
An analysis of Siemens’s historical revenue stalls illustrates how portfolio resets reinforce this sustaining posture:
FY 2018 Stall (€83.04B, -0.01% YoY): Caused by structural downturns in large gas turbines within Power & Gas, requiring capital redirection to carve out Siemens Healthineers.
FY 2020 Stall (€57.14B, -34.21% YoY): Driven by the spin-off of Siemens Energy AG and pandemic-era facility shutdowns, forcing an aggressive pivot toward recurring cloud software ARR.
FY 2024 Stall (€75.93B, -2.37% YoY): Triggered by customer destocking in Digital Industries (-8% revenue) and the Innomotics divestiture, accelerating the integration of SaaS acquisitions like Brightly Software and Altair into the Building X portfolio.
These cycles force the incumbent to treat cloud software as an incremental margin booster over its installed hardware base, rather than an engine of architectural disruption.
Fiduciary Defensibility Mandates Federated Translation Over Closed-Loop Control
Enterprise Capital Stewards operate under legal, fiduciary, and insurance constraints that make unverified autonomous building operations impossible to deploy. Chief investment officers, real estate investment trust (REIT) trustees, and institutional risk committees require documented causal verification before authorizing physical or operational adjustments across multi-million-dollar real estate assets.
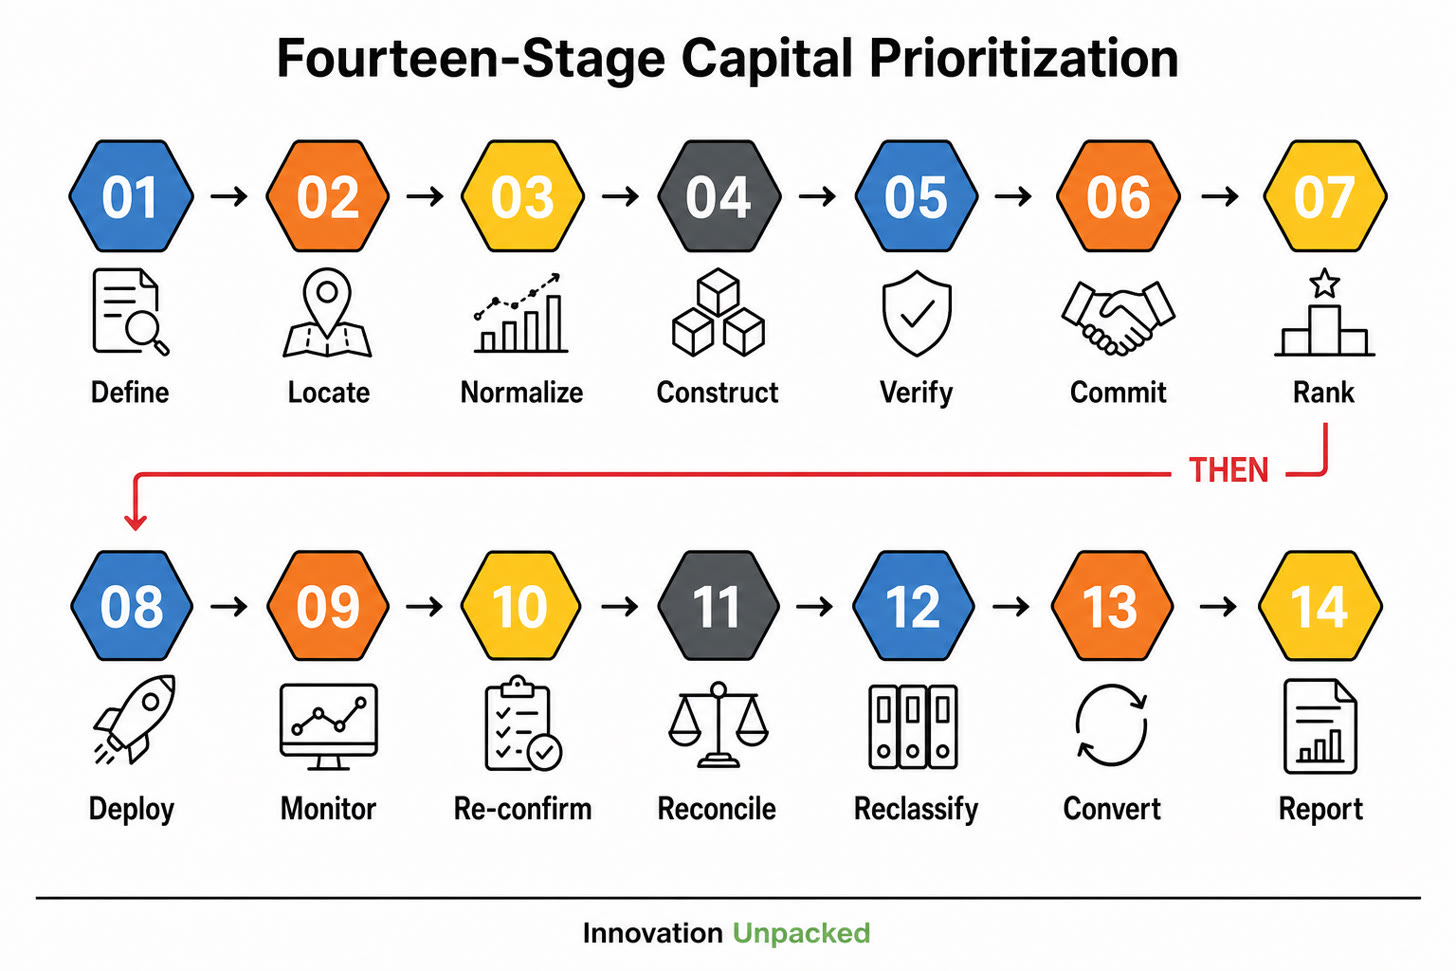
The irreducible job of enterprise portfolio governance comprises fourteen discrete lifecycle stages:
Define → Locate → Normalize → Construct → Verify → Commit → Rank → Deploy → Monitor → Re-confirm → Reconcile → Reclassify → Convert → Report
Every single stage is currently constrained by the upstream failure to express heterogeneous operational data on a common semantic axis.
Vendor narratives that pitch “self-driving buildings” and autonomous agentic setpoint adjustment fail the test of institutional governance:
Fiduciary Non-Defensibility: A capital committee cannot defend an unverified machine learning model making un-audited setpoint adjustments that risk tenant comfort penalties or breach lease-level service level agreements (SLAs).
Liability Allocation: Incumbents structure generative AI copilots strictly as Human-in-the-Loop advisory layers to legally insulate themselves from physical life-safety and operational liabilities.
Sensor Corruption Compounding: In an un-normalized operational environment, closed-loop algorithmic models optimize around undetected sensor errors, compounding mechanical equipment wear and driving hidden capital degradation.
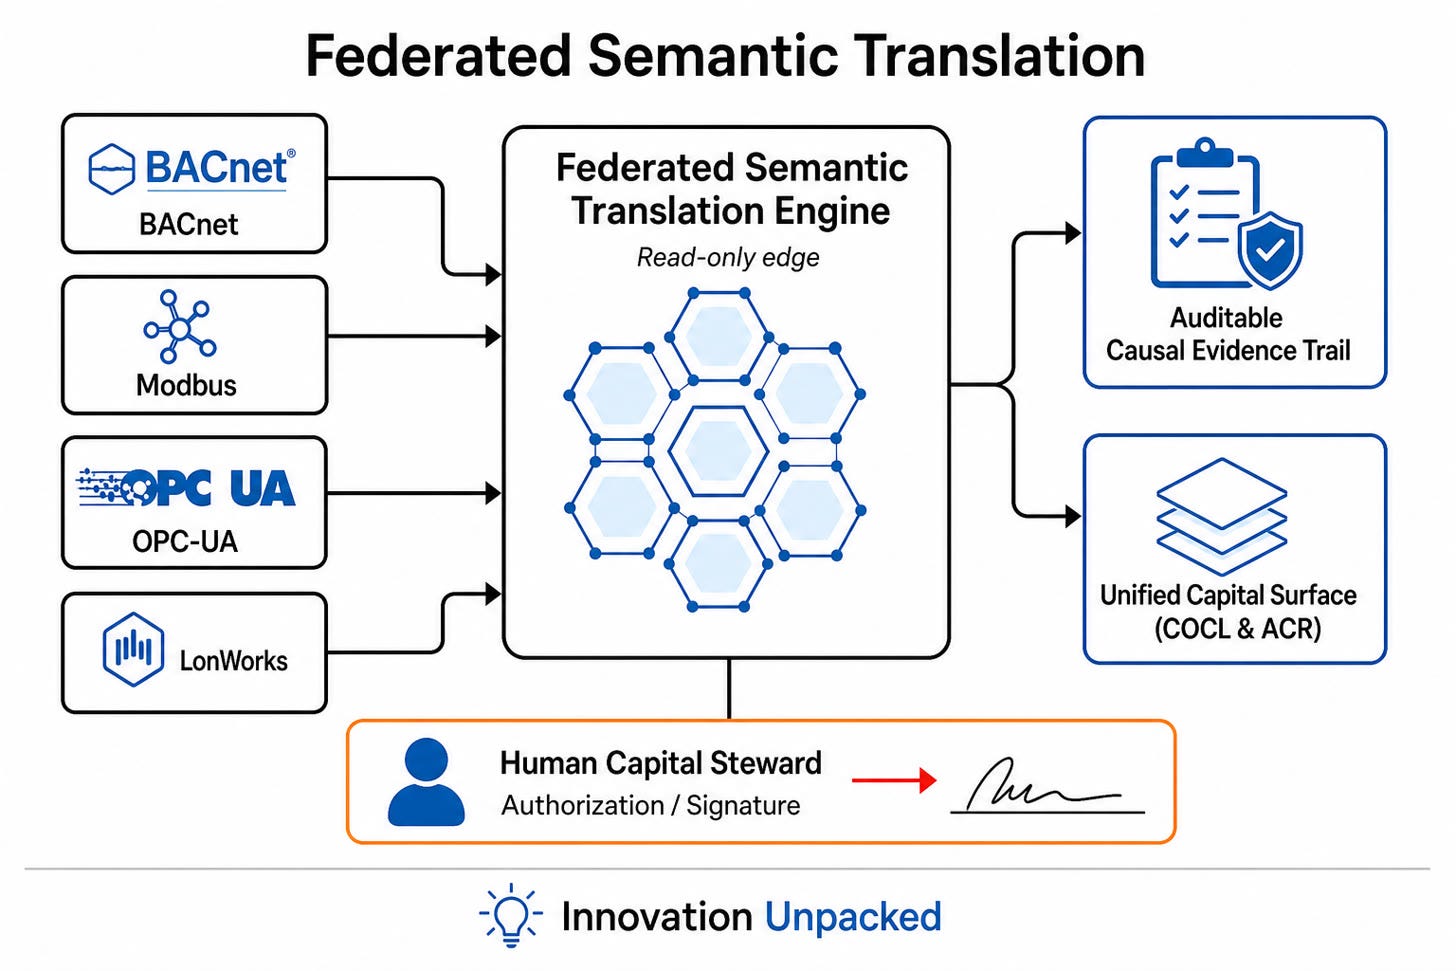
The only architecture that survives board scrutiny is a federated, read-only semantic translation layer. By normalizing disparate BACnet/IP, MS/TP, Modbus, and OPC-UA point names into an auditable schema at the edge, the platform delivers unified visibility without introducing physical control liability.
This architecture co-locates automated data normalization with immutable audit-trail generation. The Capital Steward receives verified, cross-facility risk intelligence while retaining final human sign-off on all capital allocation decisions.
Appendix: System Metrics and Mathematical Architecture
The performance and financial valuation of multi-site portfolio operations are governed by formal mathematical models measuring operational containment speed, economic value realization, and equipment capitalization structure.
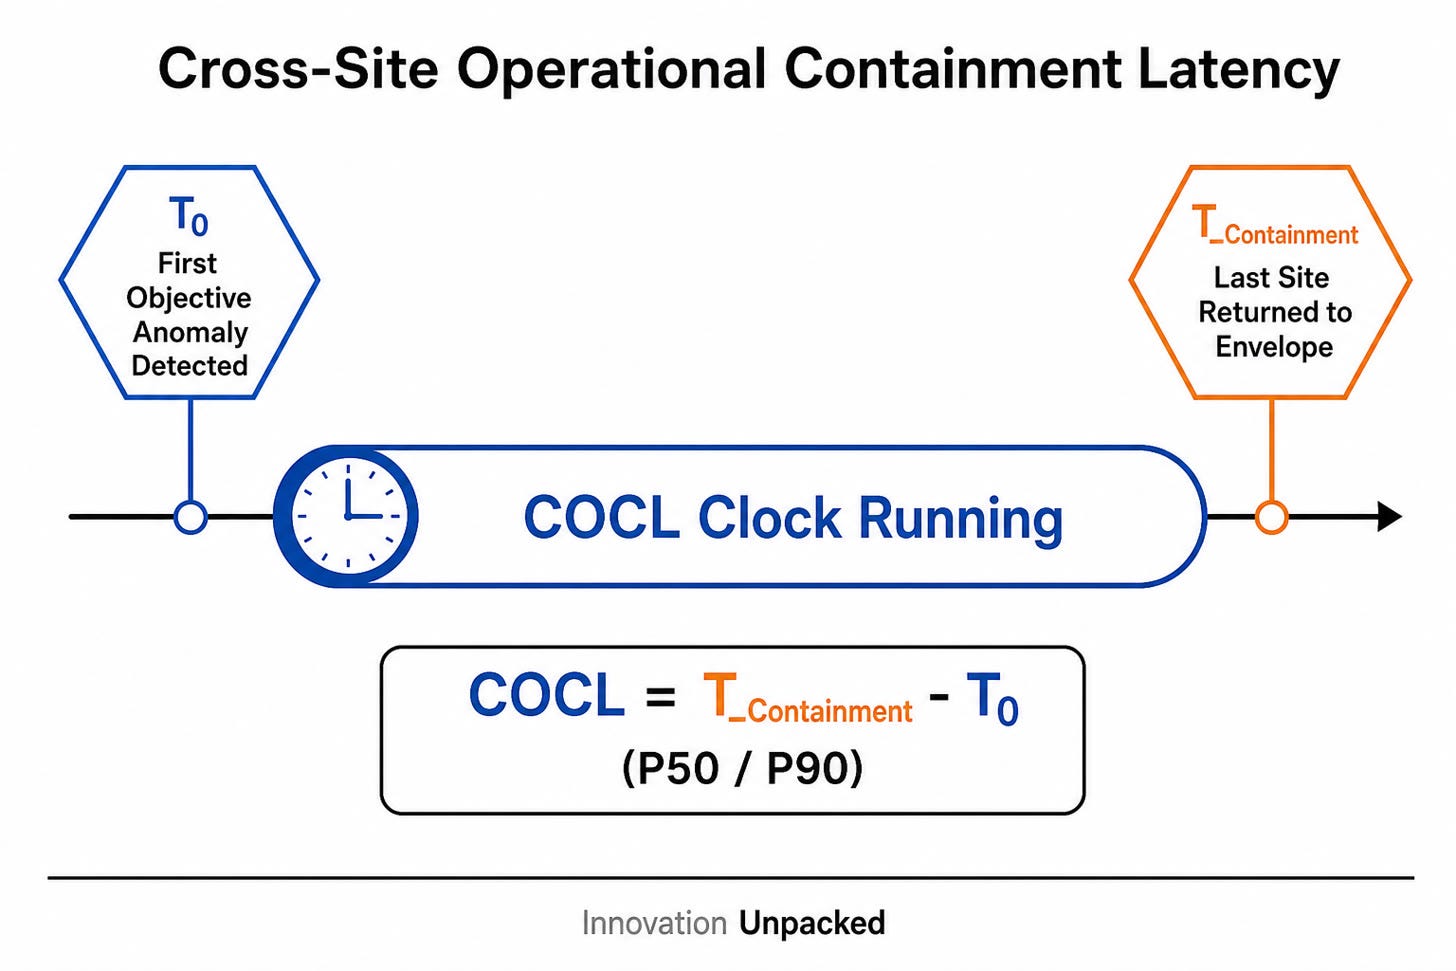
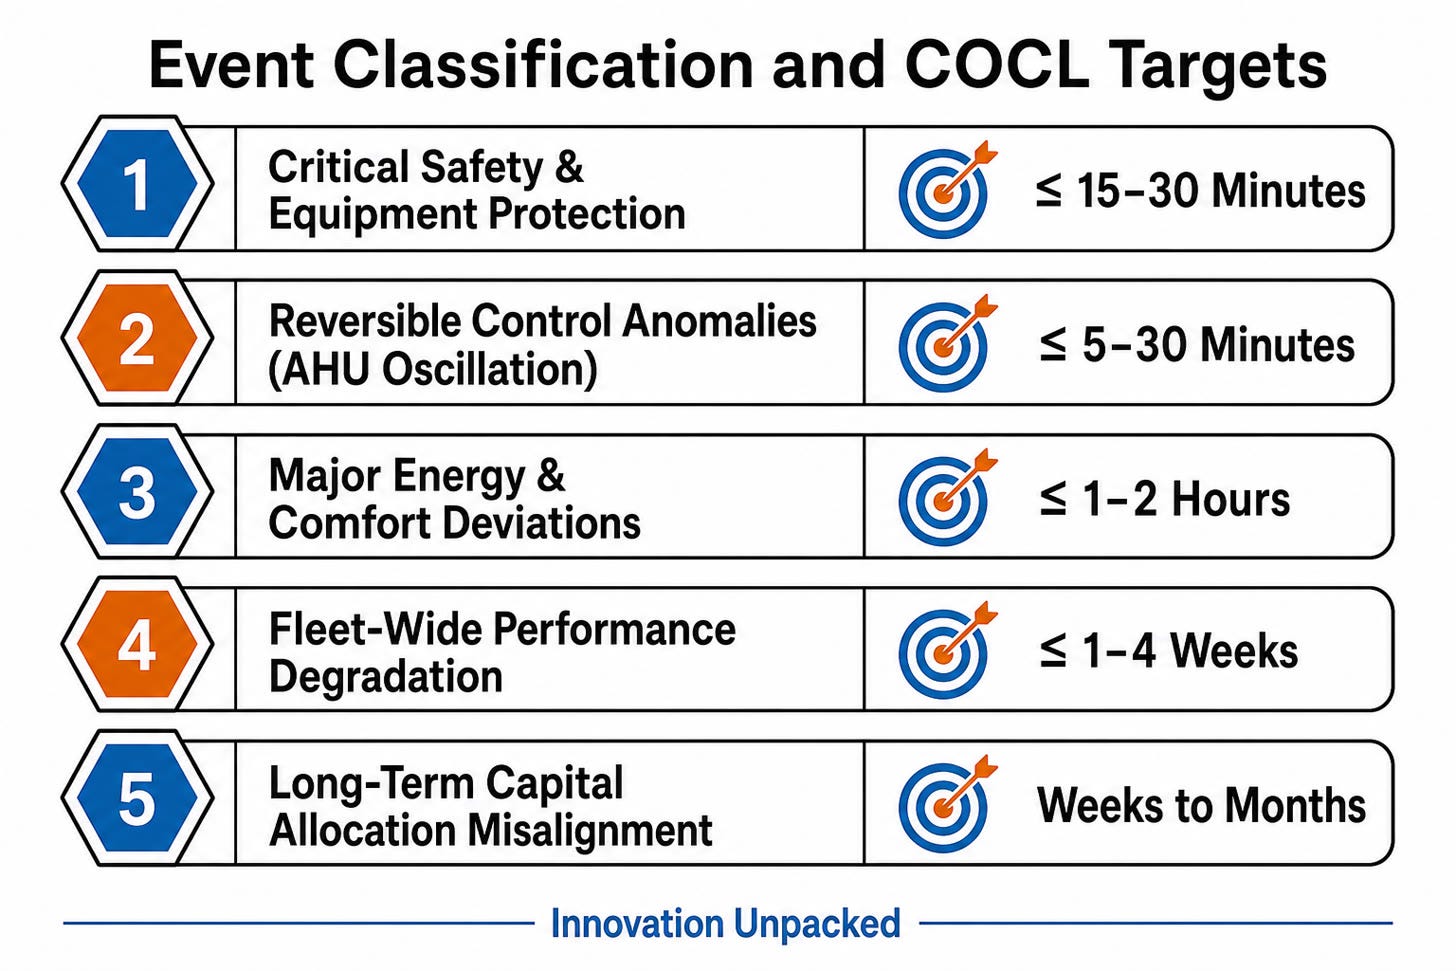
Cross-Site Operational Containment Latency (COCL)
The primary metric for portfolio-wide operational stability is Cross-Site Operational Containment Latency (COCL). COCL measures the elapsed time from the first objective detection of a cross-site operational deviation (T0) to verified, sustained containment across all affected properties:
Where:
T0 is the timestamp of the first confirmed common-mode operational anomaly meeting medium or high causal confidence thresholds.
T_containment_last_site is the timestamp at which the final affected facility in the portfolio returns to its validated operating envelope.
S_affected represents the frozen set of multi-site facilities impacted by the common-mode operational event.
The secondary operational metric is the Autonomous Containment Rate (ACR), which tracks the proportion of qualifying operational events resolved through validated, programmatic pathways without requiring manual field engineering intervention.
The Capital Value Waterfall
The realized economic value (Value_i) generated per portfolio operational event is calculated across five auditable variables:
Where:
ΔE_weather_normalizedis verified weather-normalized interval-meter energy savings.ΔD_tariffis avoided utility demand peak charges based on published tariff schedules.ΔP_contractual_SLArepresents avoided comfort and tenant lease SLA financial penalties.ΔM_work_orderis auditable reduction in external vendor and mechanical work-order expenditures.C_implementationis the allocated platform execution cost for the event.
Direct Operational Savings and Stranded Pipeline Formulations
The annual direct operational savings (ΔOpEx_annual) achieved by shifting from legacy manual extraction to the physics-floor translation layer is expressed as:
The annual preserved capital transaction pipeline volume (V_preserved) recovered by eliminating query latency is modeled by:
Applying the standard 10% platform capture fee (F_platform) yields:
Summing these vectors establishes the total annual enterprise strategic value (V_strategic):
Edge Appliance PropCo / OpCo Capital Structure
To deploy edge translation infrastructure across multi-site enterprise footprints without expanding corporate debt, the appliance hardware fleet is bifurcated into a Property Company (PropCo) and Operating Company (OpCo) financial structure:
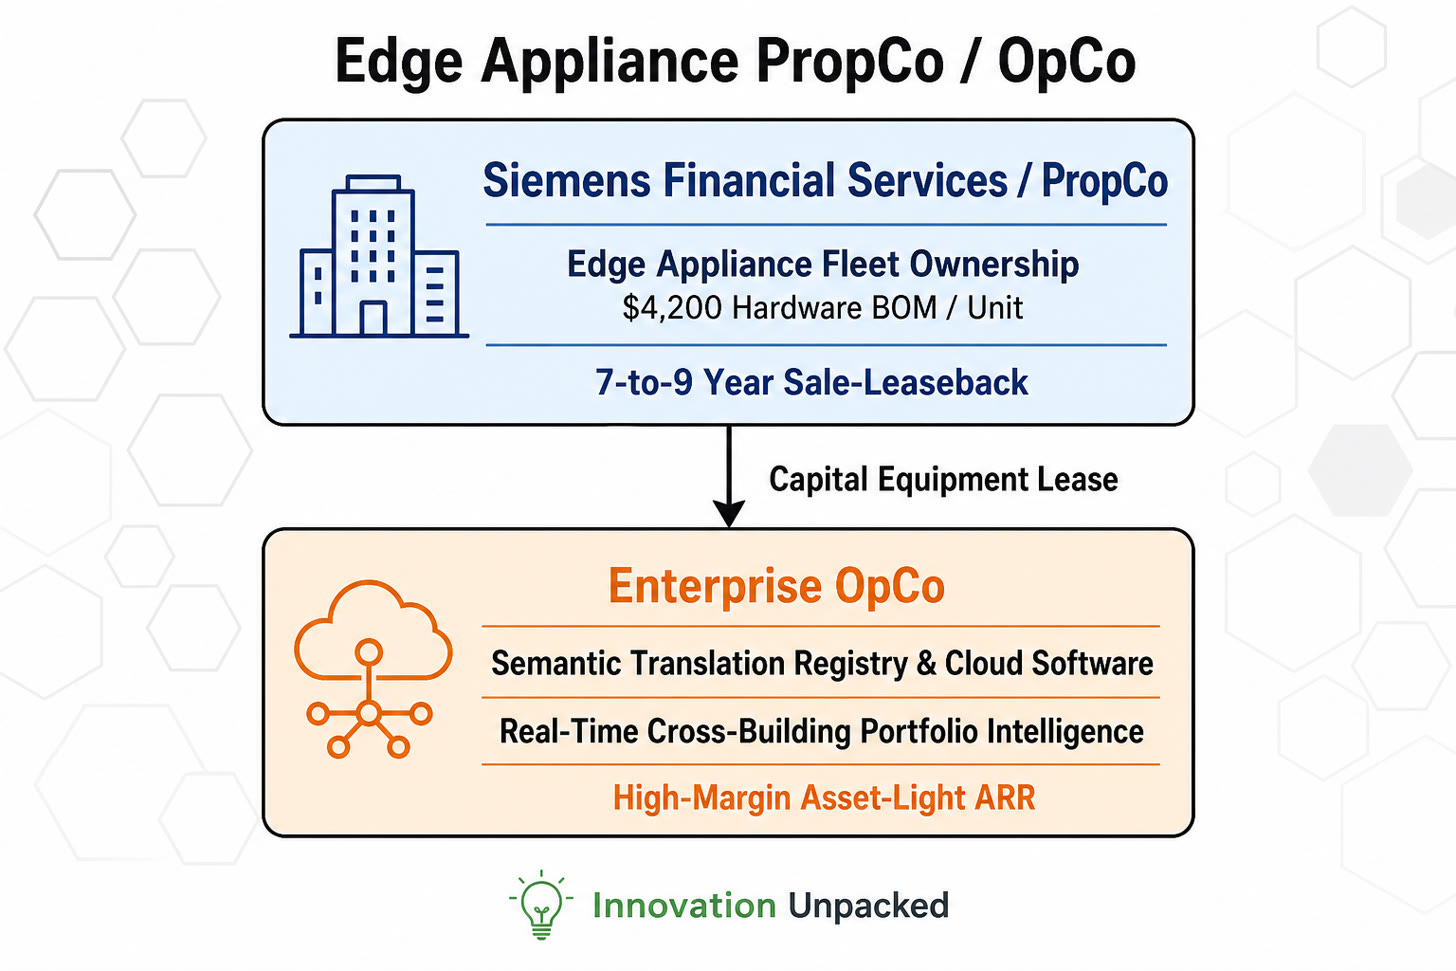
PropCo Capital Ring-Fence: Edge translation appliances, carrying a bill of materials (BOM) cost of approximately $4,200.00 per unit at production scale, are ring-fenced inside a dedicated PropCo financing vehicle structured via Siemens Financial Services (SFS). The hardware asset uses a 7-to-9 year sale-leaseback hold, neutralizing upfront balance-sheet CapEx for the enterprise operator.
OpCo Operational Core: The enterprise OpCo retains exclusive ownership of the semantic schema registry, cross-building correlation software, and high-margin recurring operational applications, preserving asset-light cash flow dynamics and enterprise valuation multiples.
Immediate Action
Terminate funding for supervisory cloud copilot overlays and conversational dashboard wrappers that add software fees on top of un-normalized legacy building controllers. Commit existing capital allocations exclusively to a federated, read-only semantic translation layer that establishes cross-facility data normalization and an auditable risk surface before signing any autonomous control agreements.
Can your capital committee verify that your multi-site facility telemetry is semantically comparable across all properties, or is your portfolio quietly absorbing an 8X cost penalty on every capital allocation review?
Is your organization interested in differentiated innovation? The world is changing quickly. If you’re not adapting to those changes, you’re not innovating. Seeking reassurance from consultants fails, nearly always (sometimes they get lucky). I work with organizations who are serious about attacking problems using first principles. Many have been burned once, and they don’t want it to happen again. Is that you? (my availability is limited).
Book an appointment: Click here
Email me: mike@pjtbd.com
Call me: +1 678-824-2789
Join the community: Click here
Follow me on 𝕏: https://x.com/mikeboysen
Articles - jtbd.one - De-Risk Your Next Big Idea
Research - studio.jtbd.one/research
Apps - studio.jtbd.one/apps
Slaying the Sacred Cows of Innovation
I worked at a company with a data translation system for telecom networks, bought out at $600M. Saw another focused on enterprise go for $5B.