
The 10x Operational Tax: Why Modern Payer Middleware is a Mathematical Trap
Complete Interactive Research Package Links Below

Free Access to Research Artifact
If you point an LLM at the public internet, you get pattern-matching and slide-deck filler—a race to the middle executed at lightspeed. In modern strategy, the model is not the moat; the proprietary data payload you query is. To prove this, I’m opening my research vault: every week, I compile a complete, industry-wide research payload (job maps, physics floors, and inversion plans) into a secure Google NotebookLM workspace. If you have a Gmail account, you can enter the workspace, query the raw math, and stress-test the data yourself. Today’s artifact is about Break the Payer Silo Slog 👈
We have an integration problem in healthcare operations—or at least, that’s what the software vendors keep telling us. Every year, millions of dollars are funneled into middleware layers, enterprise integration councils, and master data management (MDM) platforms. We build increasingly complex bridges between our systems, cross our fingers, and expect our administrative cost curves to magically bend downward.
Prefer to Listen to the Details?
This is a podcast that goes breaks the entire research package down for you.
Yet, they do not. Instead, operations teams remain trapped in an exhausting cycle of manual data entry, endless screen-switching, and inter-departmental finger-pointing—a reality affectionately known as the “swivel-chair slog”.
What if the fundamental premise of healthcare interoperability is broken? What if the tools we are buying to dissolve our departmental silos are actually designed to keep them standing?
When you strip away the slick vendor slide decks, the compliance narratives, and the organizational politics, you find a striking physical reality underneath: payer administrative friction is not a software problem; it is a labor-hour math problem governed by the unyielding laws of reconciliation physics.
A recent speculative report titled “Breaking the Payer Silo Slog” deconstructs this exact phenomenon. It outlines a staggering $874,814.16 in annual enterprise waste sitting inside a single regional payer unit. The insights contained within this document expose why traditional automation frameworks fail and how a radical architectural inversion can collapse administrative costs toward their true physical floor.
Below, we deconstruct the ten most surprising, counter-intuitive, and impactful takeaways from this groundbreaking first-principles analysis.
1. The 10.23x Inefficiency Ratio: You Are Spending Ten Times the Physics Floor on Administration
The first major shock from the data is the sheer magnitude of the gap between current operational costs and the minimum cost required by physical reality. The report introduces the Inefficiency Index, defined as the current manual execution cost divided by the physics-floor cost. For a regional payer executing cross-silo transactions across Claims Adjudication, Utilization Management, Provider Relations, and Member Services, that multiplier is a staggering 10.23x.
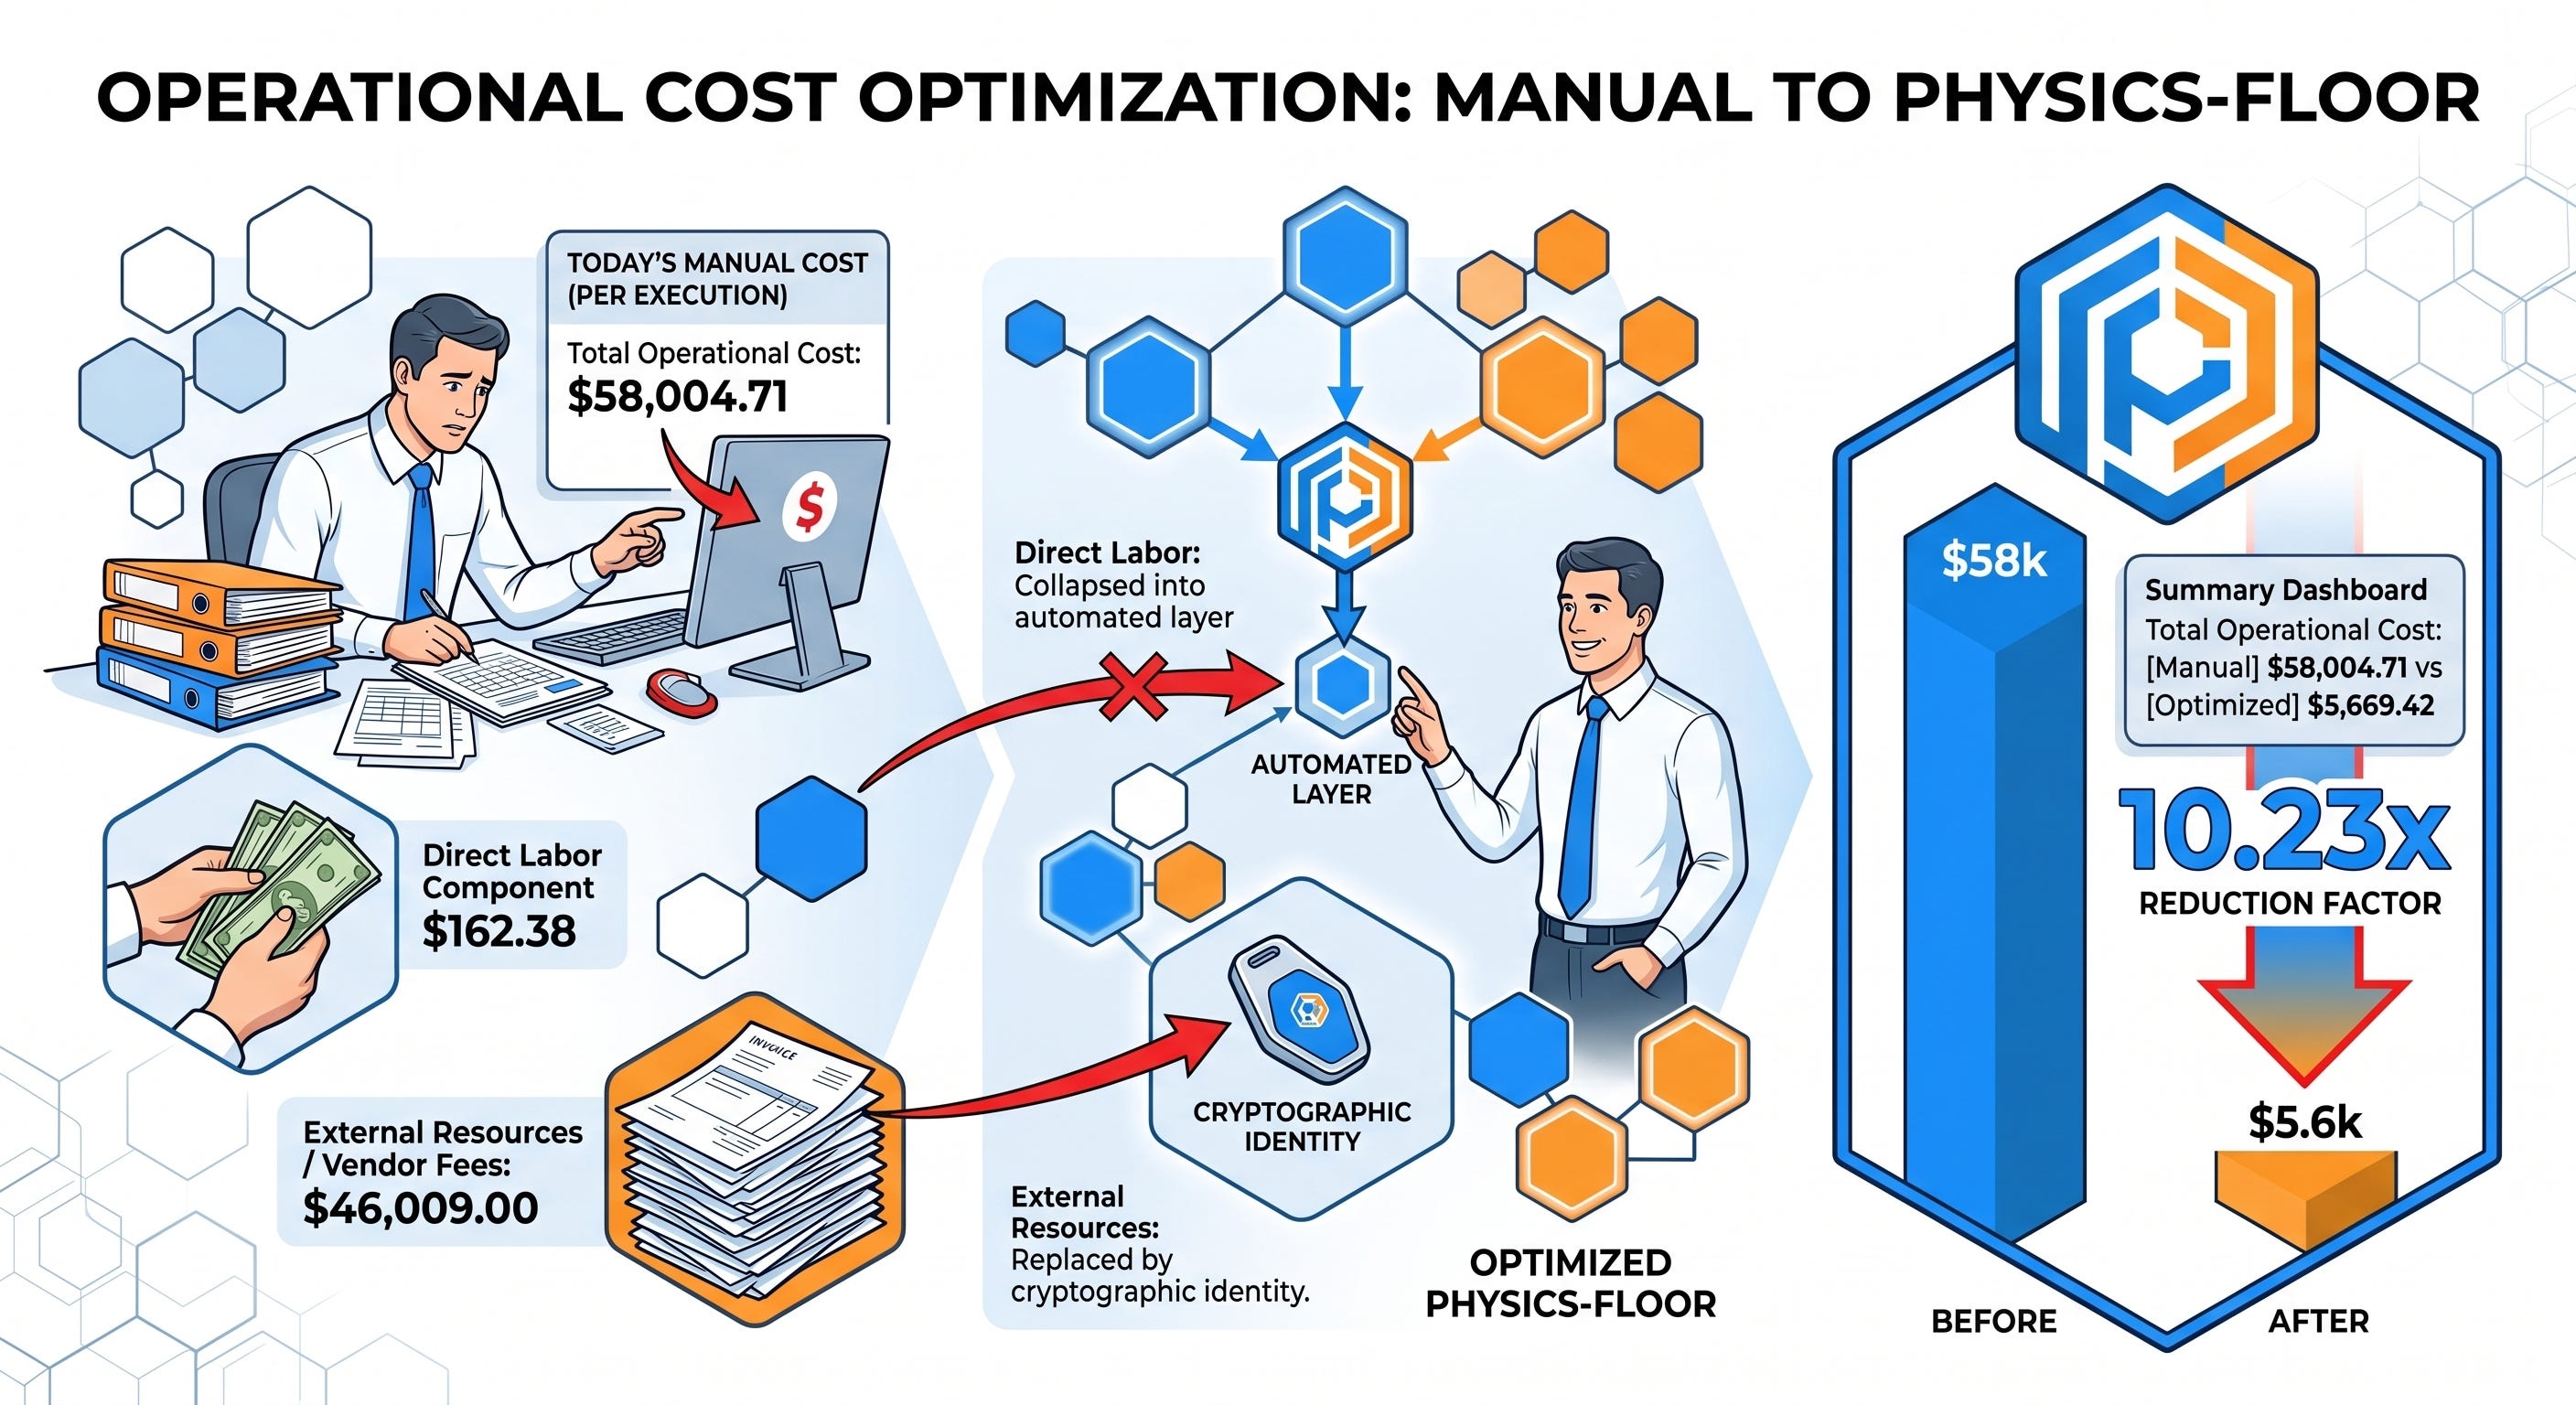
This means that over 90% of what payers spend on cross-departmental data routing is pure, unadulterated friction dressed up as “operations”. The laws of physics dictate that verifying an identity, checking eligibility, and validating a clinical record should cost pennies in computing power. Instead, regional payers absorb a massive reconciliation tax because human operators are acting as the physical integration bus between independent software platforms with non-overlapping data schemas.
“We’re spending more than ten times the physical minimum on every execution. That ratio isn’t a ‘nice-to-have optimization target.’ It’s a confession. It means 90% of the work being done today is work that doesn’t need to exist if the architecture is built correctly.”
When an organization realizes its administrative cost curve carries a 10x multiplier, localized optimizations—like training claims processors to type faster—become mathematically irrelevant. The problem is structural, and it requires an architectural solution, not behavioral adjustment.
2. The Jevons Elasticity Trap: Why Traditional Middleware Re-Bends Your Cost Curve Upward
Perhaps the most counter-intuitive insight in the entire analysis is that traditional middleware rollouts—such as Redox, Mirth Connect, or Epic’s Connection Hub—are structurally engineered near-misses. In fact, they function as mathematical traps.
This occurs because of Jevons Paradox, an economic principle stating that increases in efficiency lead to an expansion rather than a contraction of total resource consumption, provided demand is elastic. The report establishes that the Jevons Elasticity Factor (E) for payer workloads sits at 1.5.
Whenever E > 1.0, any strategy focusing solely on sustaining efficiency within the existing stack is mathematically guaranteed to trigger a volume rebound that eats its own savings.
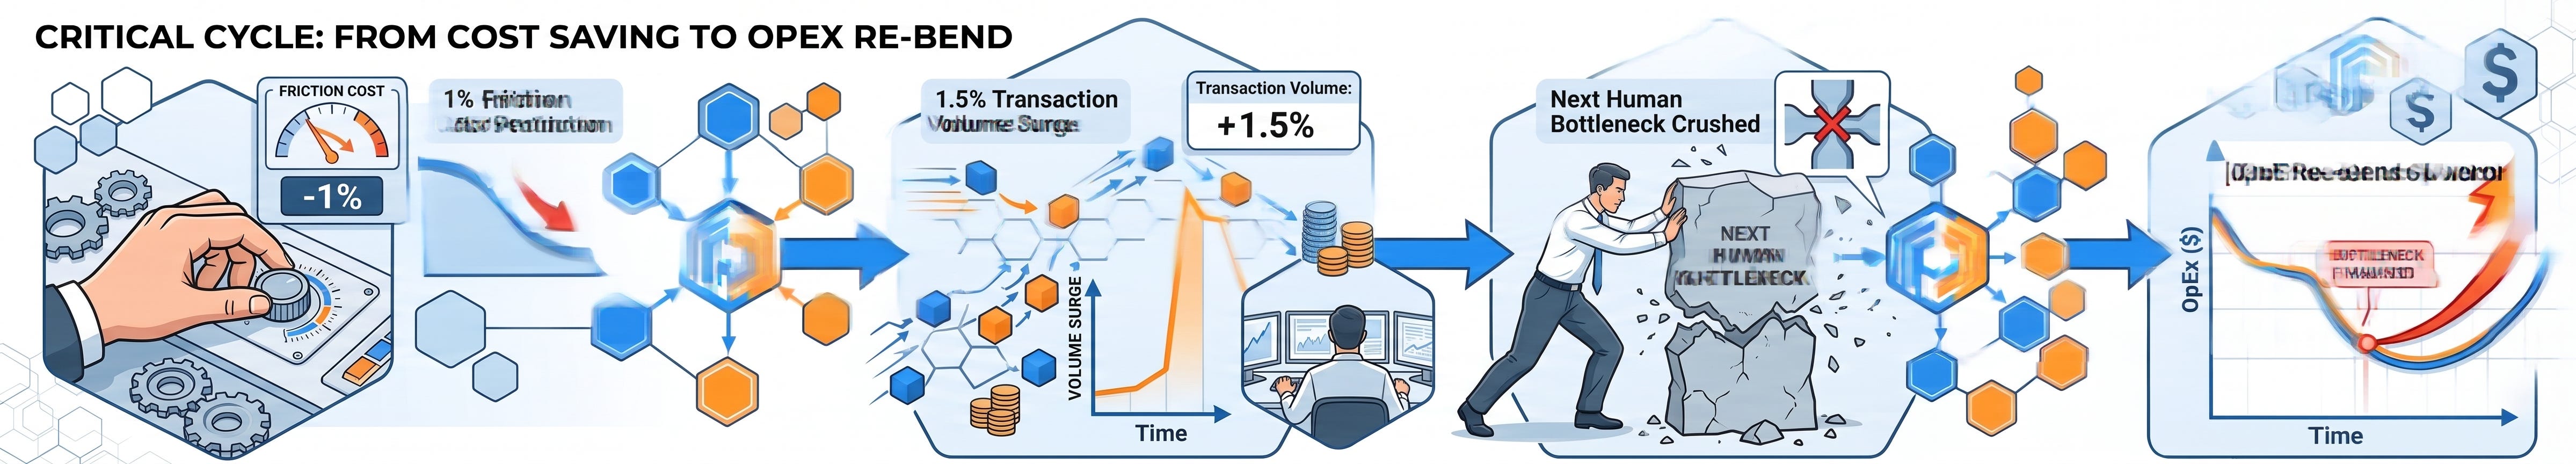
Here is how the trap plays out frame-by-frame over a 30-month lifecycle:
Year One (The Honeymoon): You deploy a middleware connector. Your per-transaction cost drops by 30%. Your dashboard looks fantastic, and the CFO is thrilled.
Year Two (The Rebound): Because you made transactions cheaper, the latent demand sitting in queues floods the pipeline. Volume surges by 45% (30% x 1.5).
Year Three (The Crash): Your automated connectors work fine, but they dump this massive wave of new volume directly onto the next human gates downstream—such as senior clinical reviewers, medical directors, and dispute specialists. Your shared-inbox exception-handling headcount quietly expands, overtime costs spike, and your overall operating expense re-bends upward.
Traditional middleware vendors are paid on connection counts and message volumes. They are financially incentivized to increase transaction complexity, meaning they profit when you fall into the Jevons trap.
3. The ‘Human-as-Integration-Bus’ Fragility: How Volume Spikes Create a $400,000 Cascade Error
When human beings serve as the communication layer between departments, the entire enterprise becomes dangerously fragile to volume spikes. Humans have a firm physical processing ceiling—typically around 40 to 50 transactions per operator per day before error rates spike and Service Level Agreements (SLAs) breach.
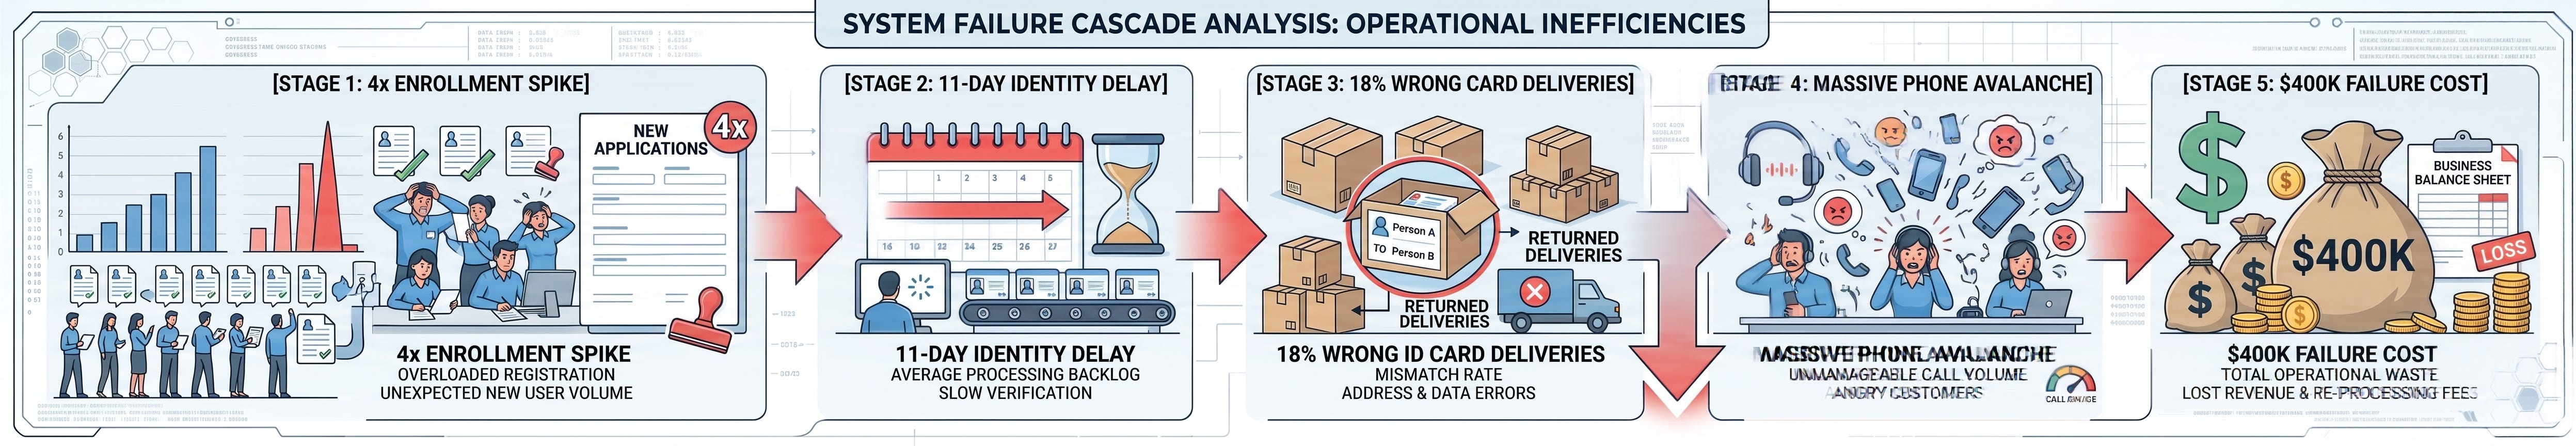
The report documents a high-impact case study of a mid-sized regional payer that illustrates this fragility during open enrollment:
The Trigger: Open enrollment caused member demographic updates to spike to four times their normal baseline volume.
The Constraint: The Member Services team, acting as the manual integration bus to resolve cross-silo identities, fell 11 business days behind schedule.
The Cascade: Because identities were stuck in a queue, 18% of new-member ID cards were automatically mailed to wrong addresses. This triggered an avalanche of angry provider-relations and member-services phone calls, each requiring cross-departmental reconciliation.
The Economic Impact: This single operational bottleneck cost the company north of $400,000 in overtime labor, emergency postage, and member retention credits.
This case study proves that the “swivel-chair slog” is not just an annoying operational drag—it is an existential risk. Relying on human attention spans to bridge disparate software platforms means you are betting your entire customer experience on a foundation that fractures the moment transaction volume doubles.
4. The Power of Pure Subtraction: Five Legacy Elements You Must Delete, Not Automate
Traditional digital transformation frameworks operate on a principle of addition. They advise adding platforms, adding governance committees, adding chatbot overlays, and adding middleware layers. The report takes a sledgehammer to this approach, arguing instead for structural subtraction.
To close the gap to the physics floor, you do not need to build new tech; you need to courageously delete five deeply embedded legacy rituals:
The Subtraction Playbook
Subtraction #1: The Multi-Identity Pattern. Legacy systems maintain independent schemas—subscriber IDs in Claims, medical record numbers in Utilization Management, and roster links in Provider Relations. Delete three of the four keys. Force every platform to resolve just-in-time to a single canonical member key, melting away hours of human translation work.
Subtraction #2: Interview-Based Discovery Loops. Throughput owners traditionally spend weeks interviewing department managers to locate workflow intersections. Delete the interview loops. Replace them with streamed system metadata that maps handoff frequencies automatically. Stop asking humans to narrate their work.
Subtraction #3: The Sequential Compliance Gate. Project managers typically sequence software deployment after discrete HITRUST or SOC 2 Type II certification events. Delete this temporal dependency. Deploy your unified workspace inside a continuously-monitored, certified perimeter from day one. Run compliance and integration in parallel to cut months of latency.
Subtraction #4: The Narrative Vendor Pitch. Delete slide-deck procurement cycles based on feature lists and seat-count licensing. Replace them with one-page contract amendments tied strictly to machine-observed transaction cost reductions.
Subtraction #5: The Shared-Inbox Exception Pool. The teams of 8 to 14 FTEs routing emails and faxes between departments are not functional teams—they are symptoms of a broken architecture. Delete the shared queue and swap it for an automated exception router.
“Traditional interoperability is like unclogging a drain by adding more water. Path-dependent reconciliation is like replacing the drain entirely. We’re not trying to make the slog flow faster. We’re trying to make the slog not exist.”
5. The Billion-Dollar Valuation of Suppressed Demand: Why Demand Preservation Beats Cost-Cutting 4-to-1
When operations leaders think about dismantling silos, they almost always frame the business case around cost reduction (OpEx recovery). However, the report reveals a profound structural inversion: the largest value pool in healthcare administration is not cutting costs, but preserving demand.
Let’s look at the global strategic impact numbers uncovered in the report’s baseline regional unit:
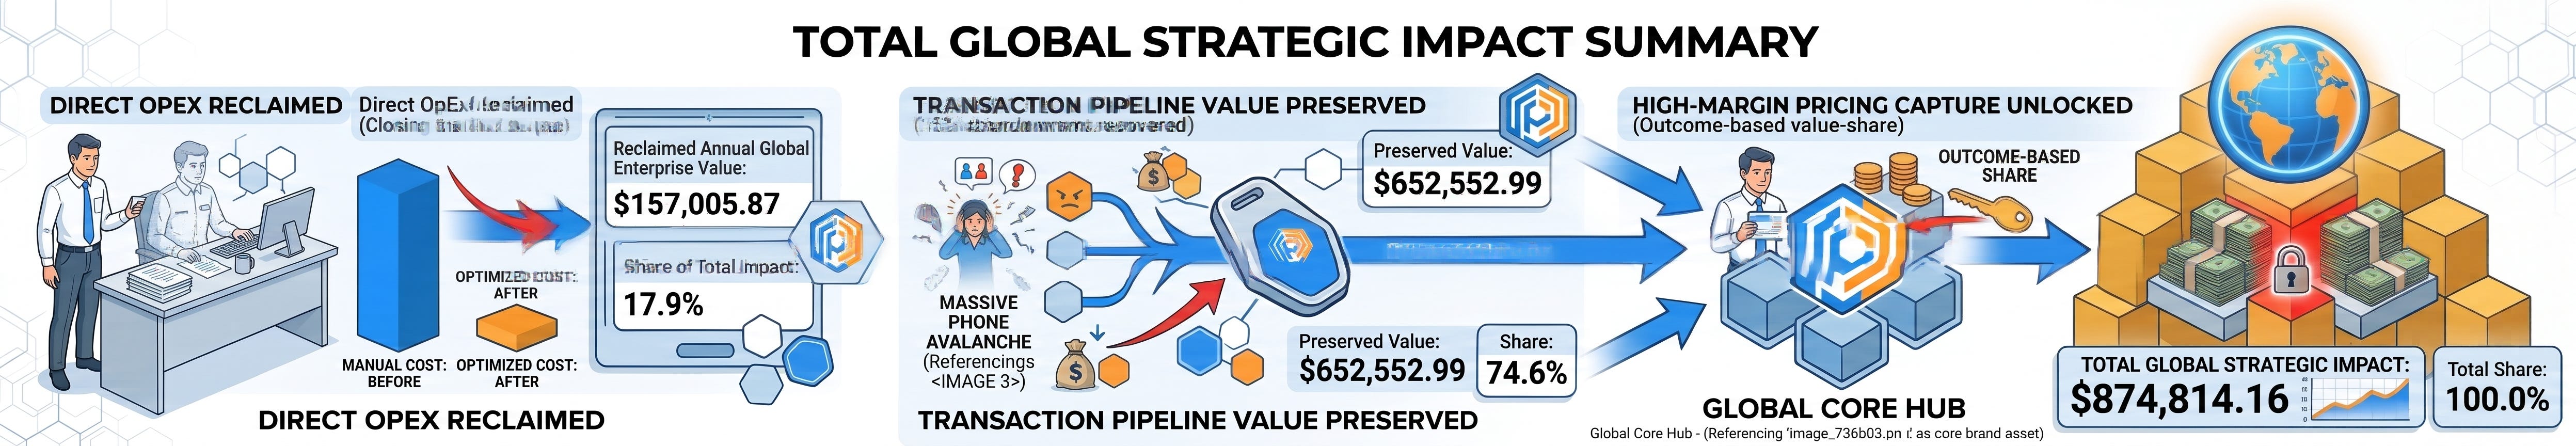
Notice that direct labor savings account for less than 18% of the prize. The real money sits in the $652,552.99 in preserved pipeline value.
When a payer’s manual cross-silo process causes a prior authorization or credentialing action to drag out for 11 business days, providers and members do not just sit around waiting. In 15% of cases, they simply abandon the workflow entirely. Providers route patients to other facilities, and members drop out of necessary care pipelines.
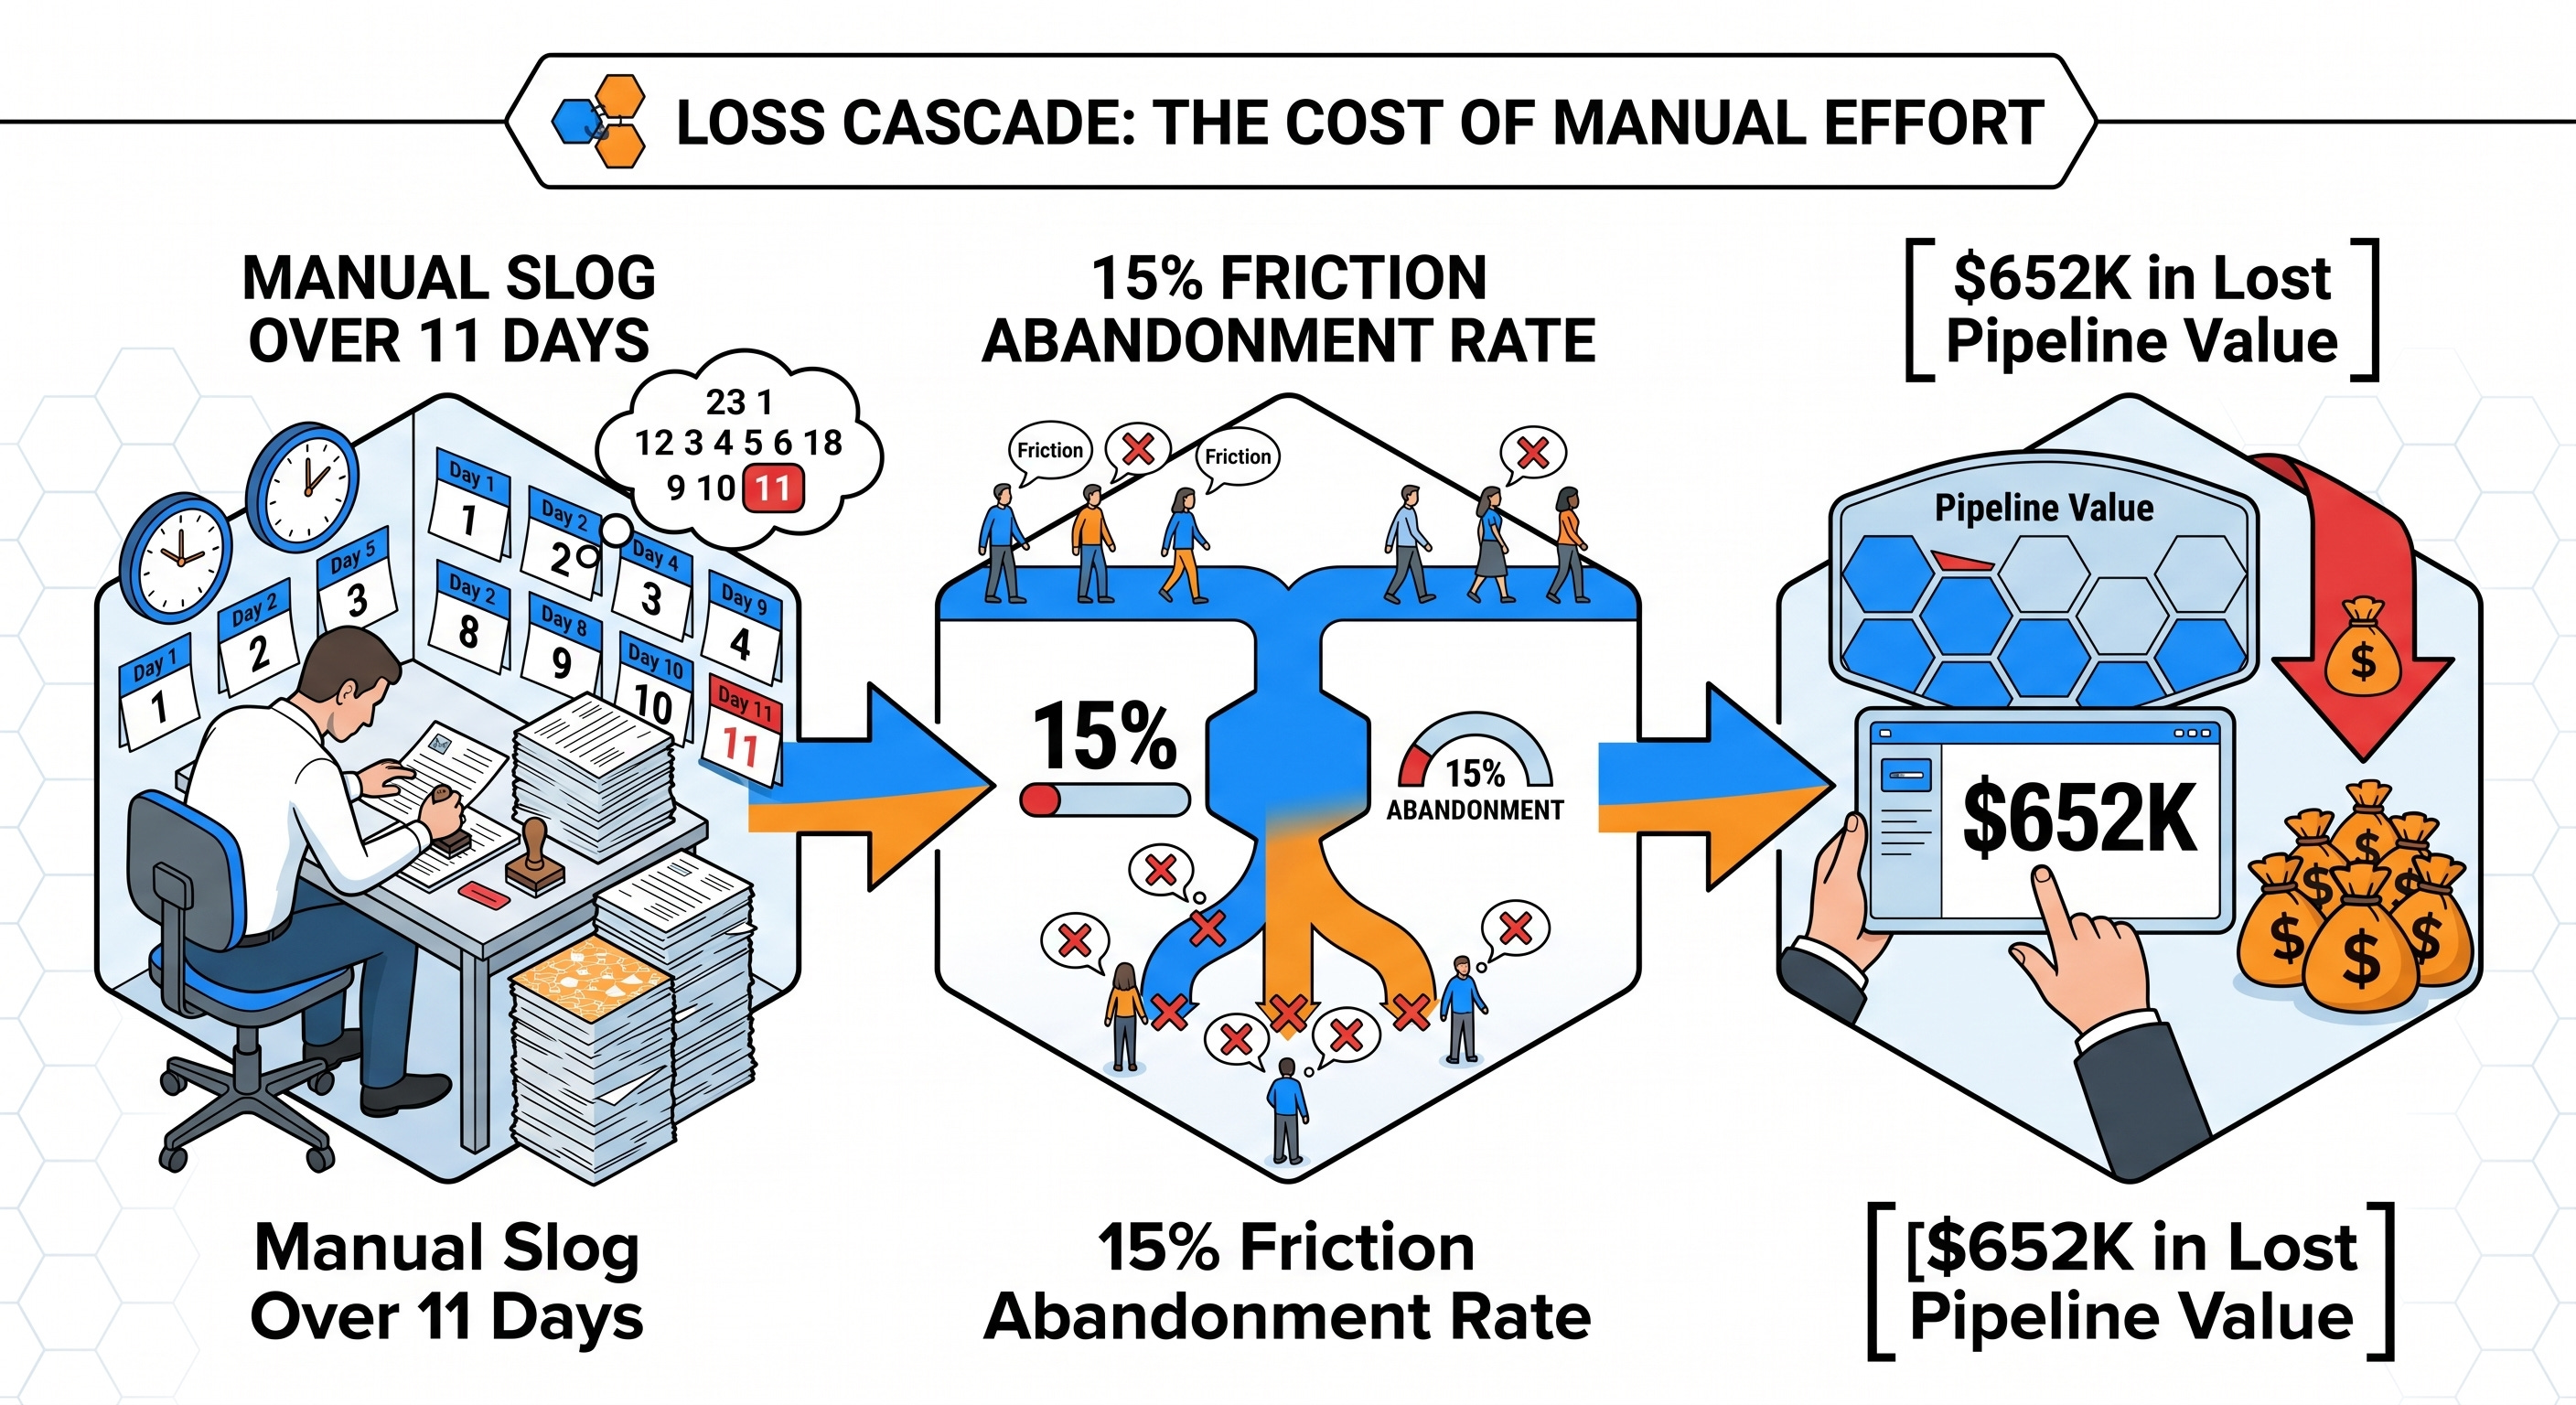
When you collapse reconciliation cycle times from days to minutes, you are not just saving a clerk’s hourly wage—you are plugging a massive revenue leak and retaining customers who were silently walking out the door.
6. Just-in-Time Identity Resolution: Bypassing the Multi-Million Dollar MDM Death March
If identity divergence across systems is the root physical cause of administrative waste, why have traditional master data management (MDM) platforms failed to fix it? The report points to a clear historical pattern: traditional MDM identity projects cost between $1.4M and $2.4M upfront, carry a 100% CFO rejection rate for manual baselines, and routinely dissolve into sunk-cost write-offs.
The reason is that legacy MDM attempts to pre-emptively unify data models across the entire enterprise data warehouse. This triggers endless multi-quarter political debates over data ownership.
The solution outlined in the report is an elegant technical detour: Just-in-Time (JIT) Identity Resolution.
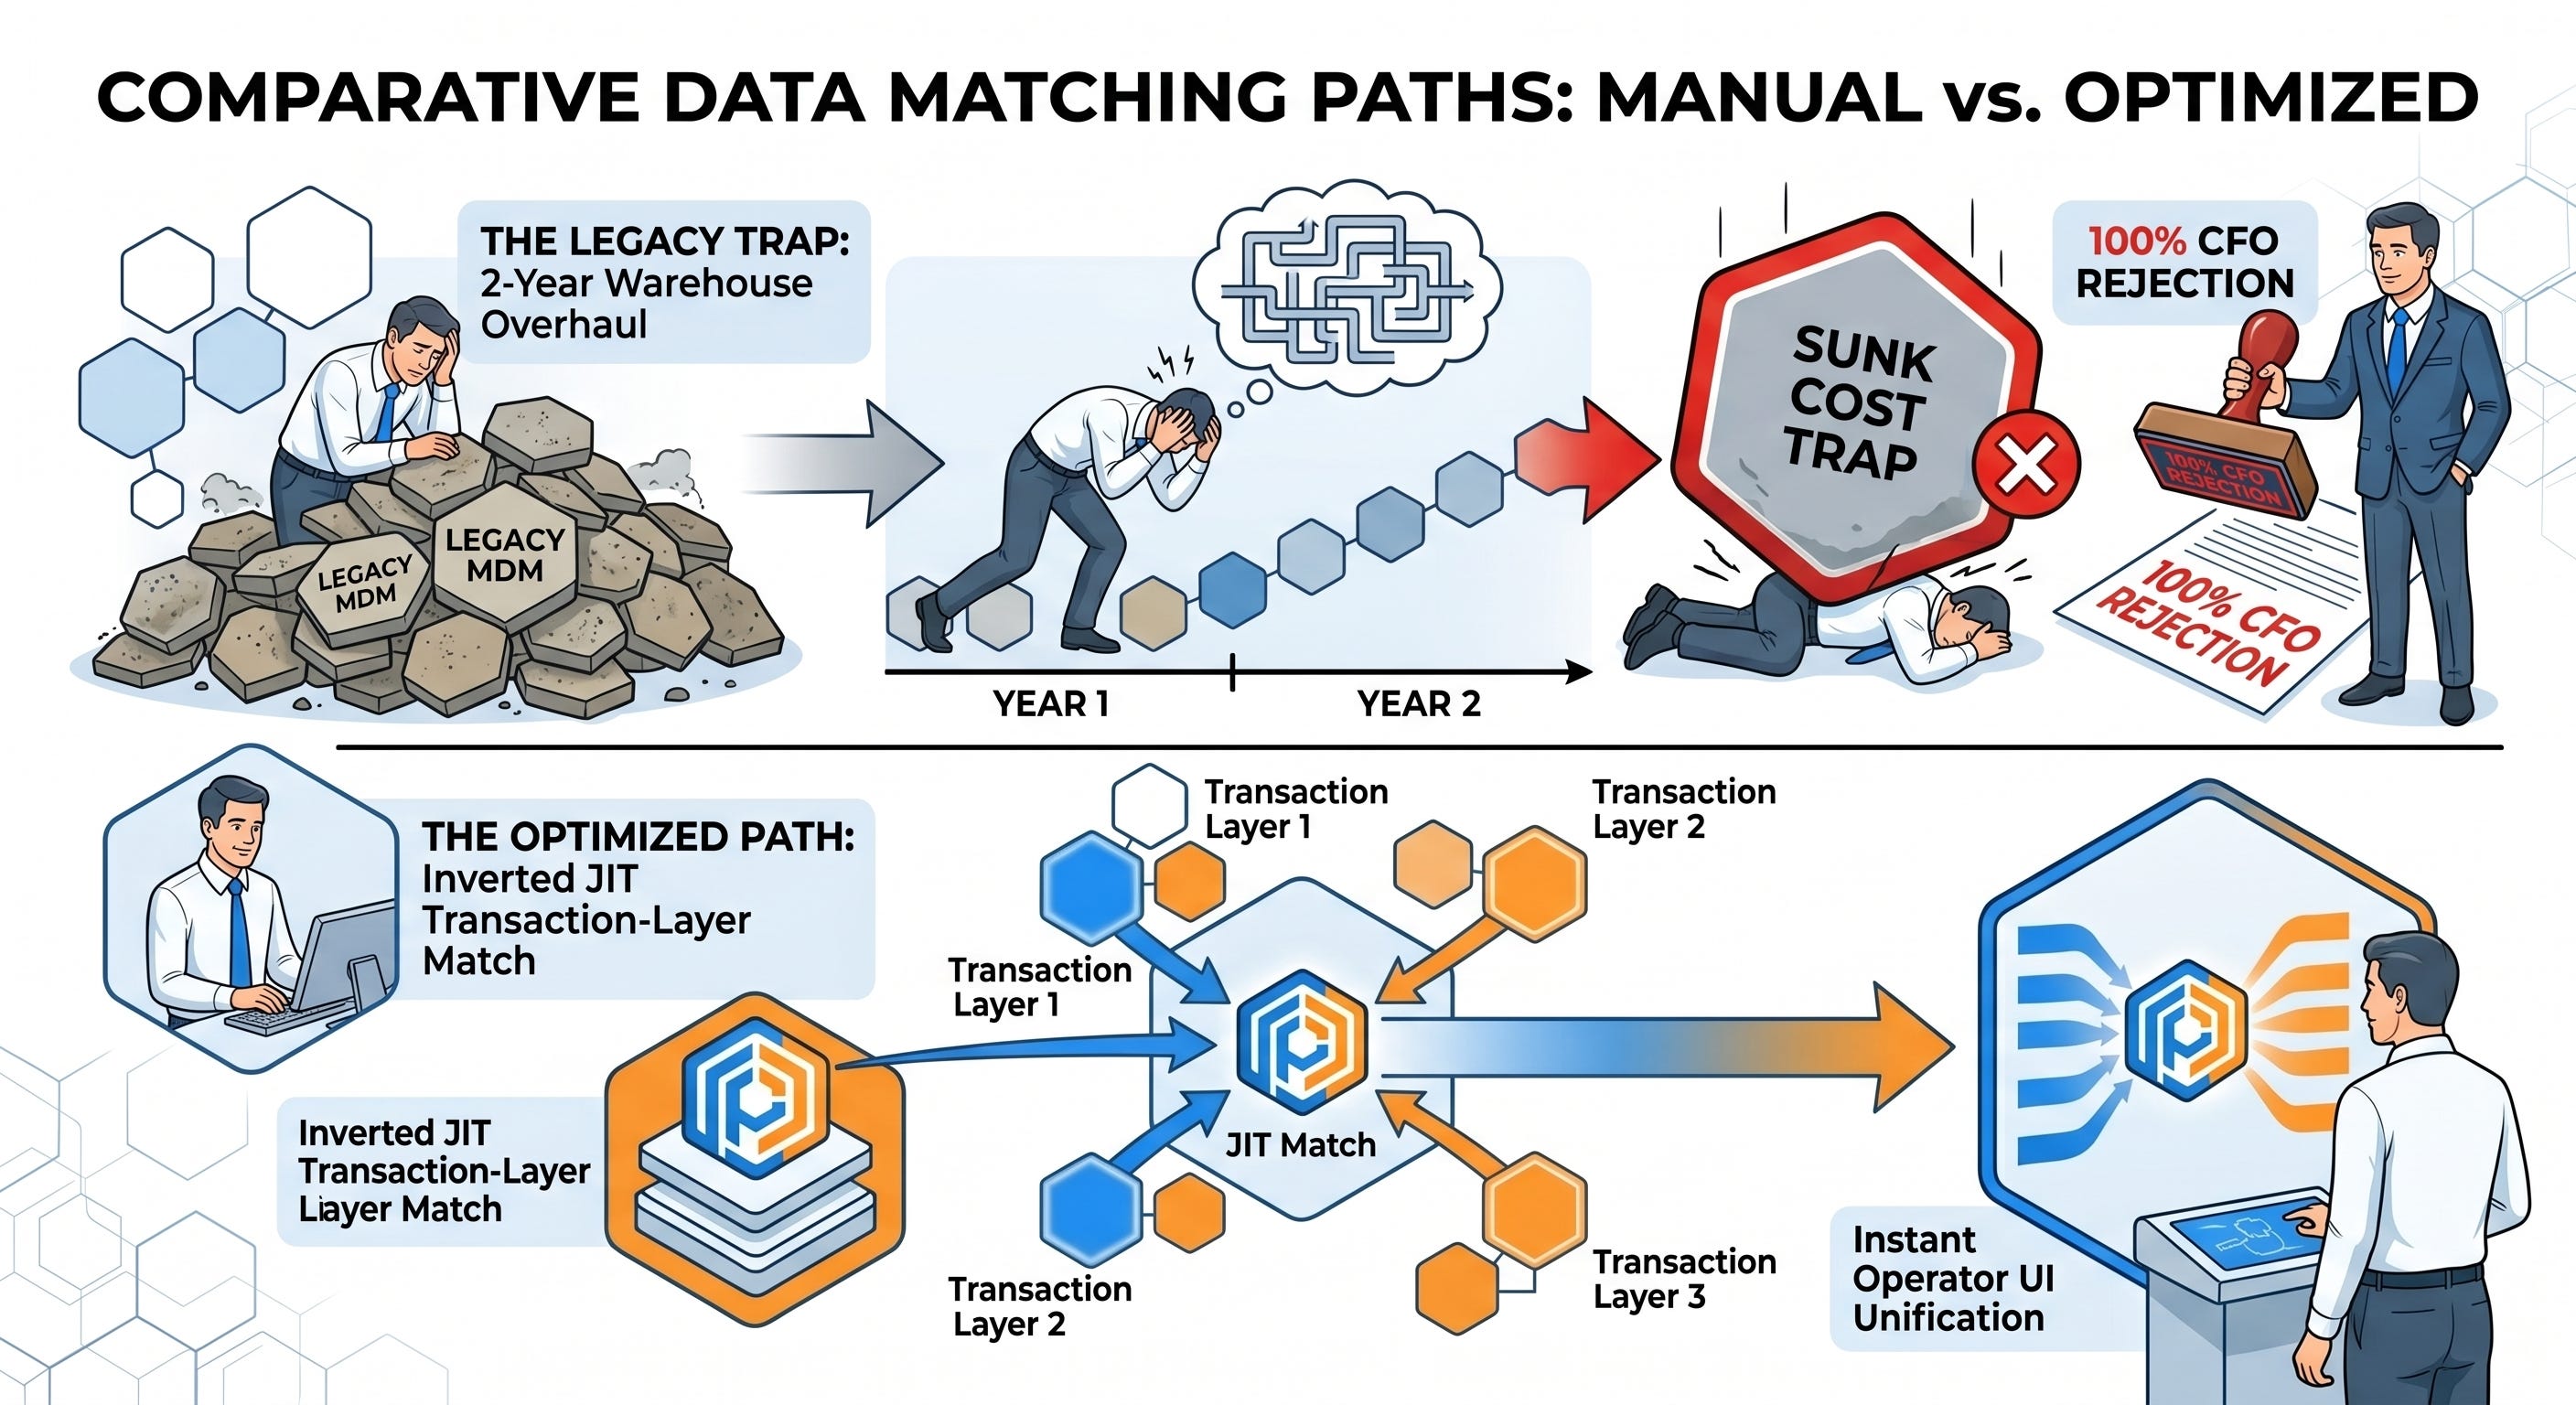
Instead of trying to clean up back-end database schemas, JIT identity resolution matches records probabilistically at the agentic transaction layer at the precise moment an operator needs the data. It computes a confidence score and presents a single, unified member object to the operator UI without modifying the legacy system of record.
By framing identity resolution as a transaction-level service rather than a centralized capital project, you completely bypass the CapEx reinvestment barriers that stall traditional IT roadmaps.
7. The Federated Excess Capacity Inversion: Turning Cost Centers into Supply Nodes
One of the most radical concepts in the report is the idea of Federated Excess Capacity. It suggests that payers do not need to buy net-new automation infrastructure because their internal departments have already built the highly scalable substrates required to solve the problem.
Over the years, desperate internal teams have engineered their own local workarounds to cope with legacy software failures. The Claims team scripted an eligibility verification engine; the Utilization Management team built custom clinical history pulls; Member Services automated shared-inbox triage logic.
Right now, these custom tools operate as underutilized, disconnected cost centers. The report’s proposed architecture acts as a federated orchestrator that links these localized nodes together into a shared network layer.
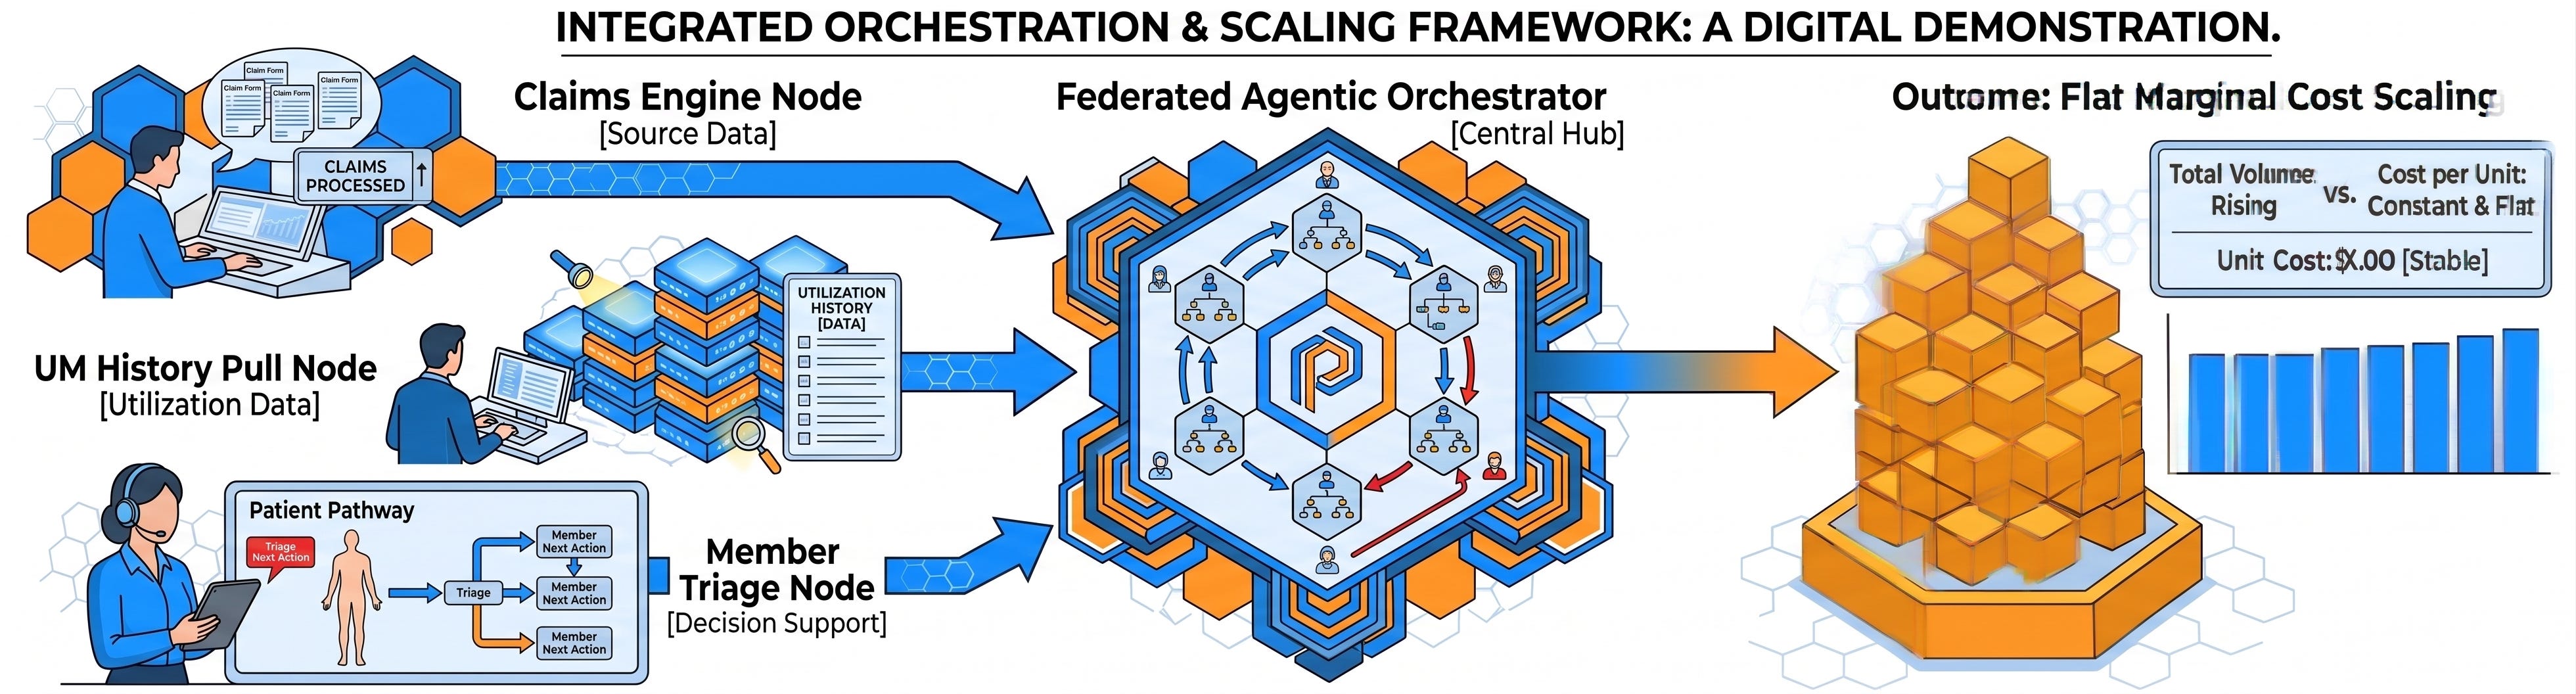
When you link these customer-created engines, you unlock massive excess capacity. A regional claims engine that currently runs thousands of lookups can easily process millions.
By shifting the infrastructure from human labor to software-driven federated capacity, the marginal cost per transaction stays virtually flat as volume scales. The Jevons Paradox elasticity factor of 1.5 is transformed from an operational threat into a massive asset: volume growth now drives pure margin because the system no longer requires incremental headcount to process a surge.
8. Breaking the 15% Trust Ceiling: How the Verifiability Layer Crushes Automation Counter-Overrides
Most automation initiatives hit a hard, invisible barrier known as the trust ceiling. In traditional payer environments, human operators manually override automated system decisions at a rate of 15% to 20%.
This override behavior is not driven by system error; it is driven by operator skepticism. Operators have been burned by AI hallucinations, out-of-sync databases, and black-box algorithms that provide zero explanation for their outputs. This override rate effectively imposes a permanent cost floor on any automation rollout.
Pathway C breaks this ceiling by constructing a robust Human-in-the-Loop (HITL) Trust Bridge composed of three core telemetry elements:
The Trust Substrate
The Verifiability Layer: The platform streams comprehensive, audit-grade transparency logs directly into the workspace, showing the operator exactly which legacy systems were queried to make a data match.
Freshness Guarantees: Every identity match and cross-silo data field is stamped with a precise freshness time, allowing operators to verify that the data is current before accepting it.
100% N-Count Sampling: Every single automated decision is logged, traceable, and available for continuous control auditing, removing any need for hand-sampled stopwatch time-studies.
The data shows that when operators are provided with real-time visibility into data freshness and confidence metrics, their manual override rate collapses from over 20% down to under 5%. The exception tail is transformed from a permanent overhead burden into a self-funding machine-learning loop.
9. The Cross-Silo Redundancy Rate (CSRR): A North Star Metric Auditable by Logs, Not Surveys
Most organizations track operational health using metrics that are fundamentally flawed. They rely on localized metrics like claims per FTE, or they deploy soft, retrospective tools like manual time-studies and consultant-led focus groups.
The report establishes a new, auditable North Star metric designed to survive intense financial scrutiny: the Cross-Silo Redundancy Rate (CSRR).
Because CSRR is tracked at the individual data-field level using system metadata and event logs, it cannot be manipulated or self-reported by department heads.
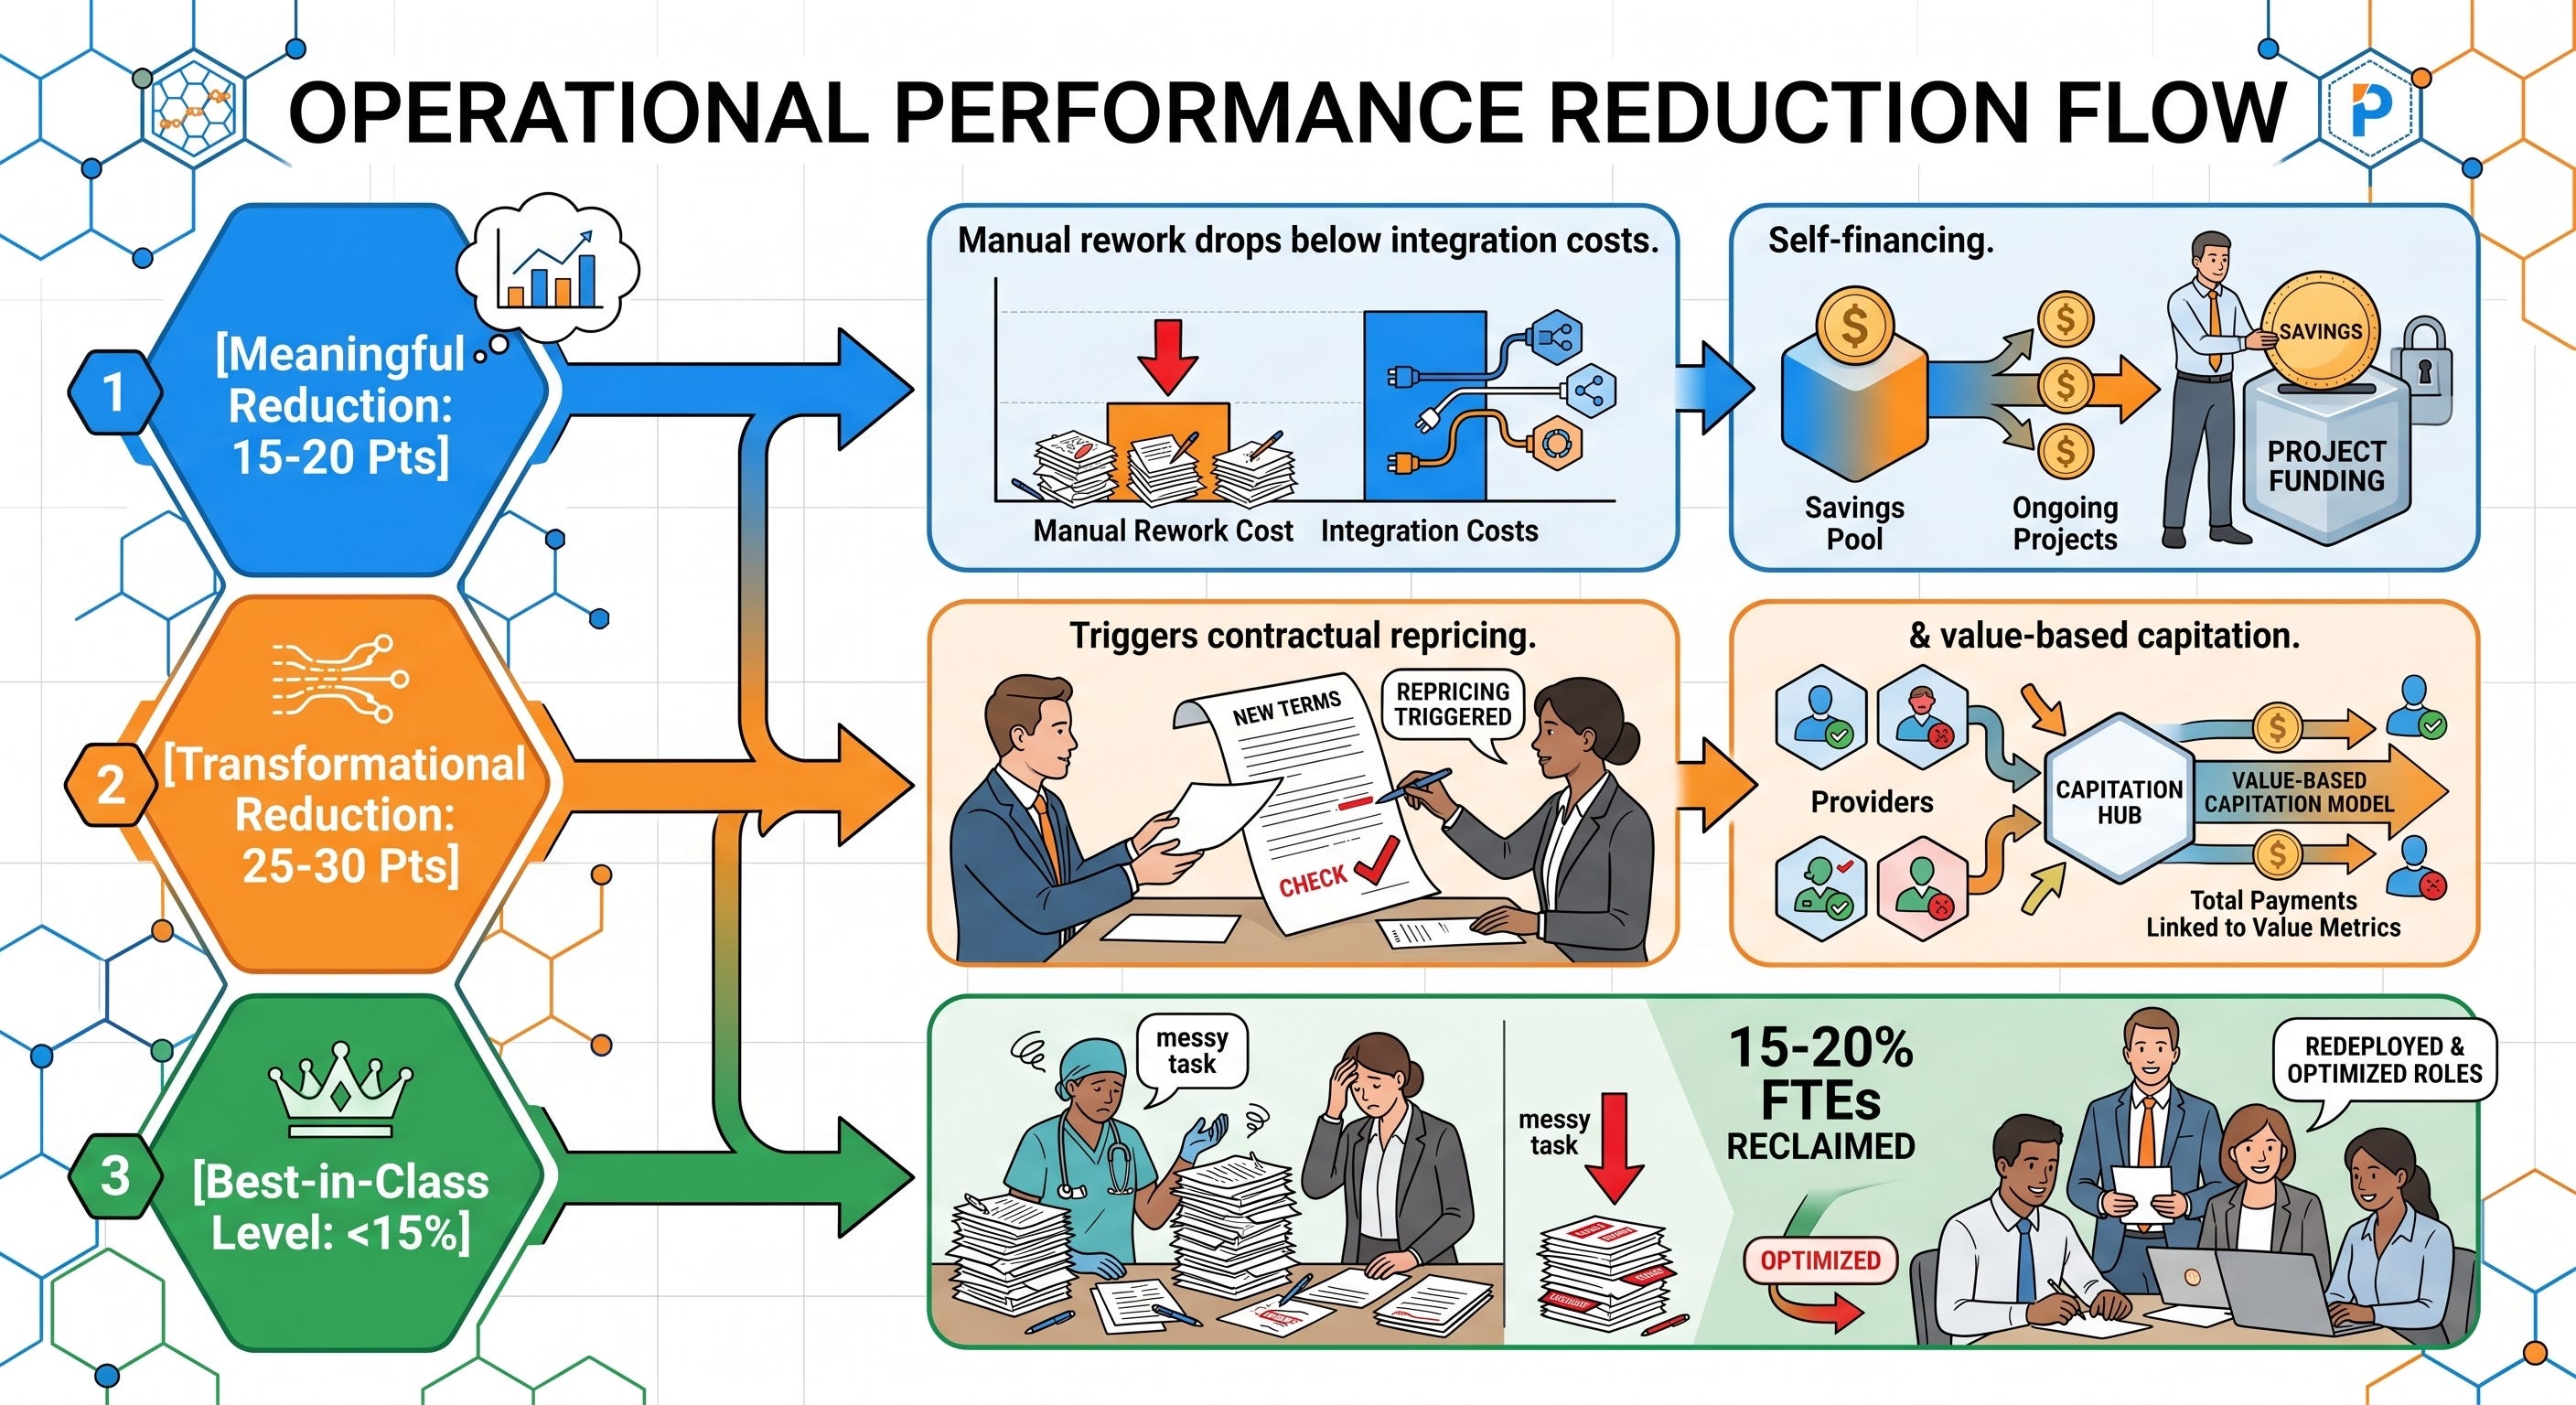
At a blended administrative rate of $42.50 per hour, compressing your CSRR by just a single absolute percentage point recovers roughly $1,000 to $1,700 per workflow annually. For a mid-sized regional payer, hitting the transformational target represents an immediate, auditable cash recovery of $4M to $8M in annual SG&A.
10. Real Options Framework: Viewing Operational Intersections as Portfolio Call Options
The final breakthrough concept from the report is the deployment of a Real Options Framework for operational engineering. Traditionally, software deployment is viewed as an all-or-nothing commitment: you invest millions upfront, build a massive pipeline, and pray that the payback model holds true over a five-year horizon.
A real options lens flips this entirely, treating every high-friction workflow intersection as an independent financial call option that you can choose to exercise, defer, or abandon based on real-time empirical evidence.
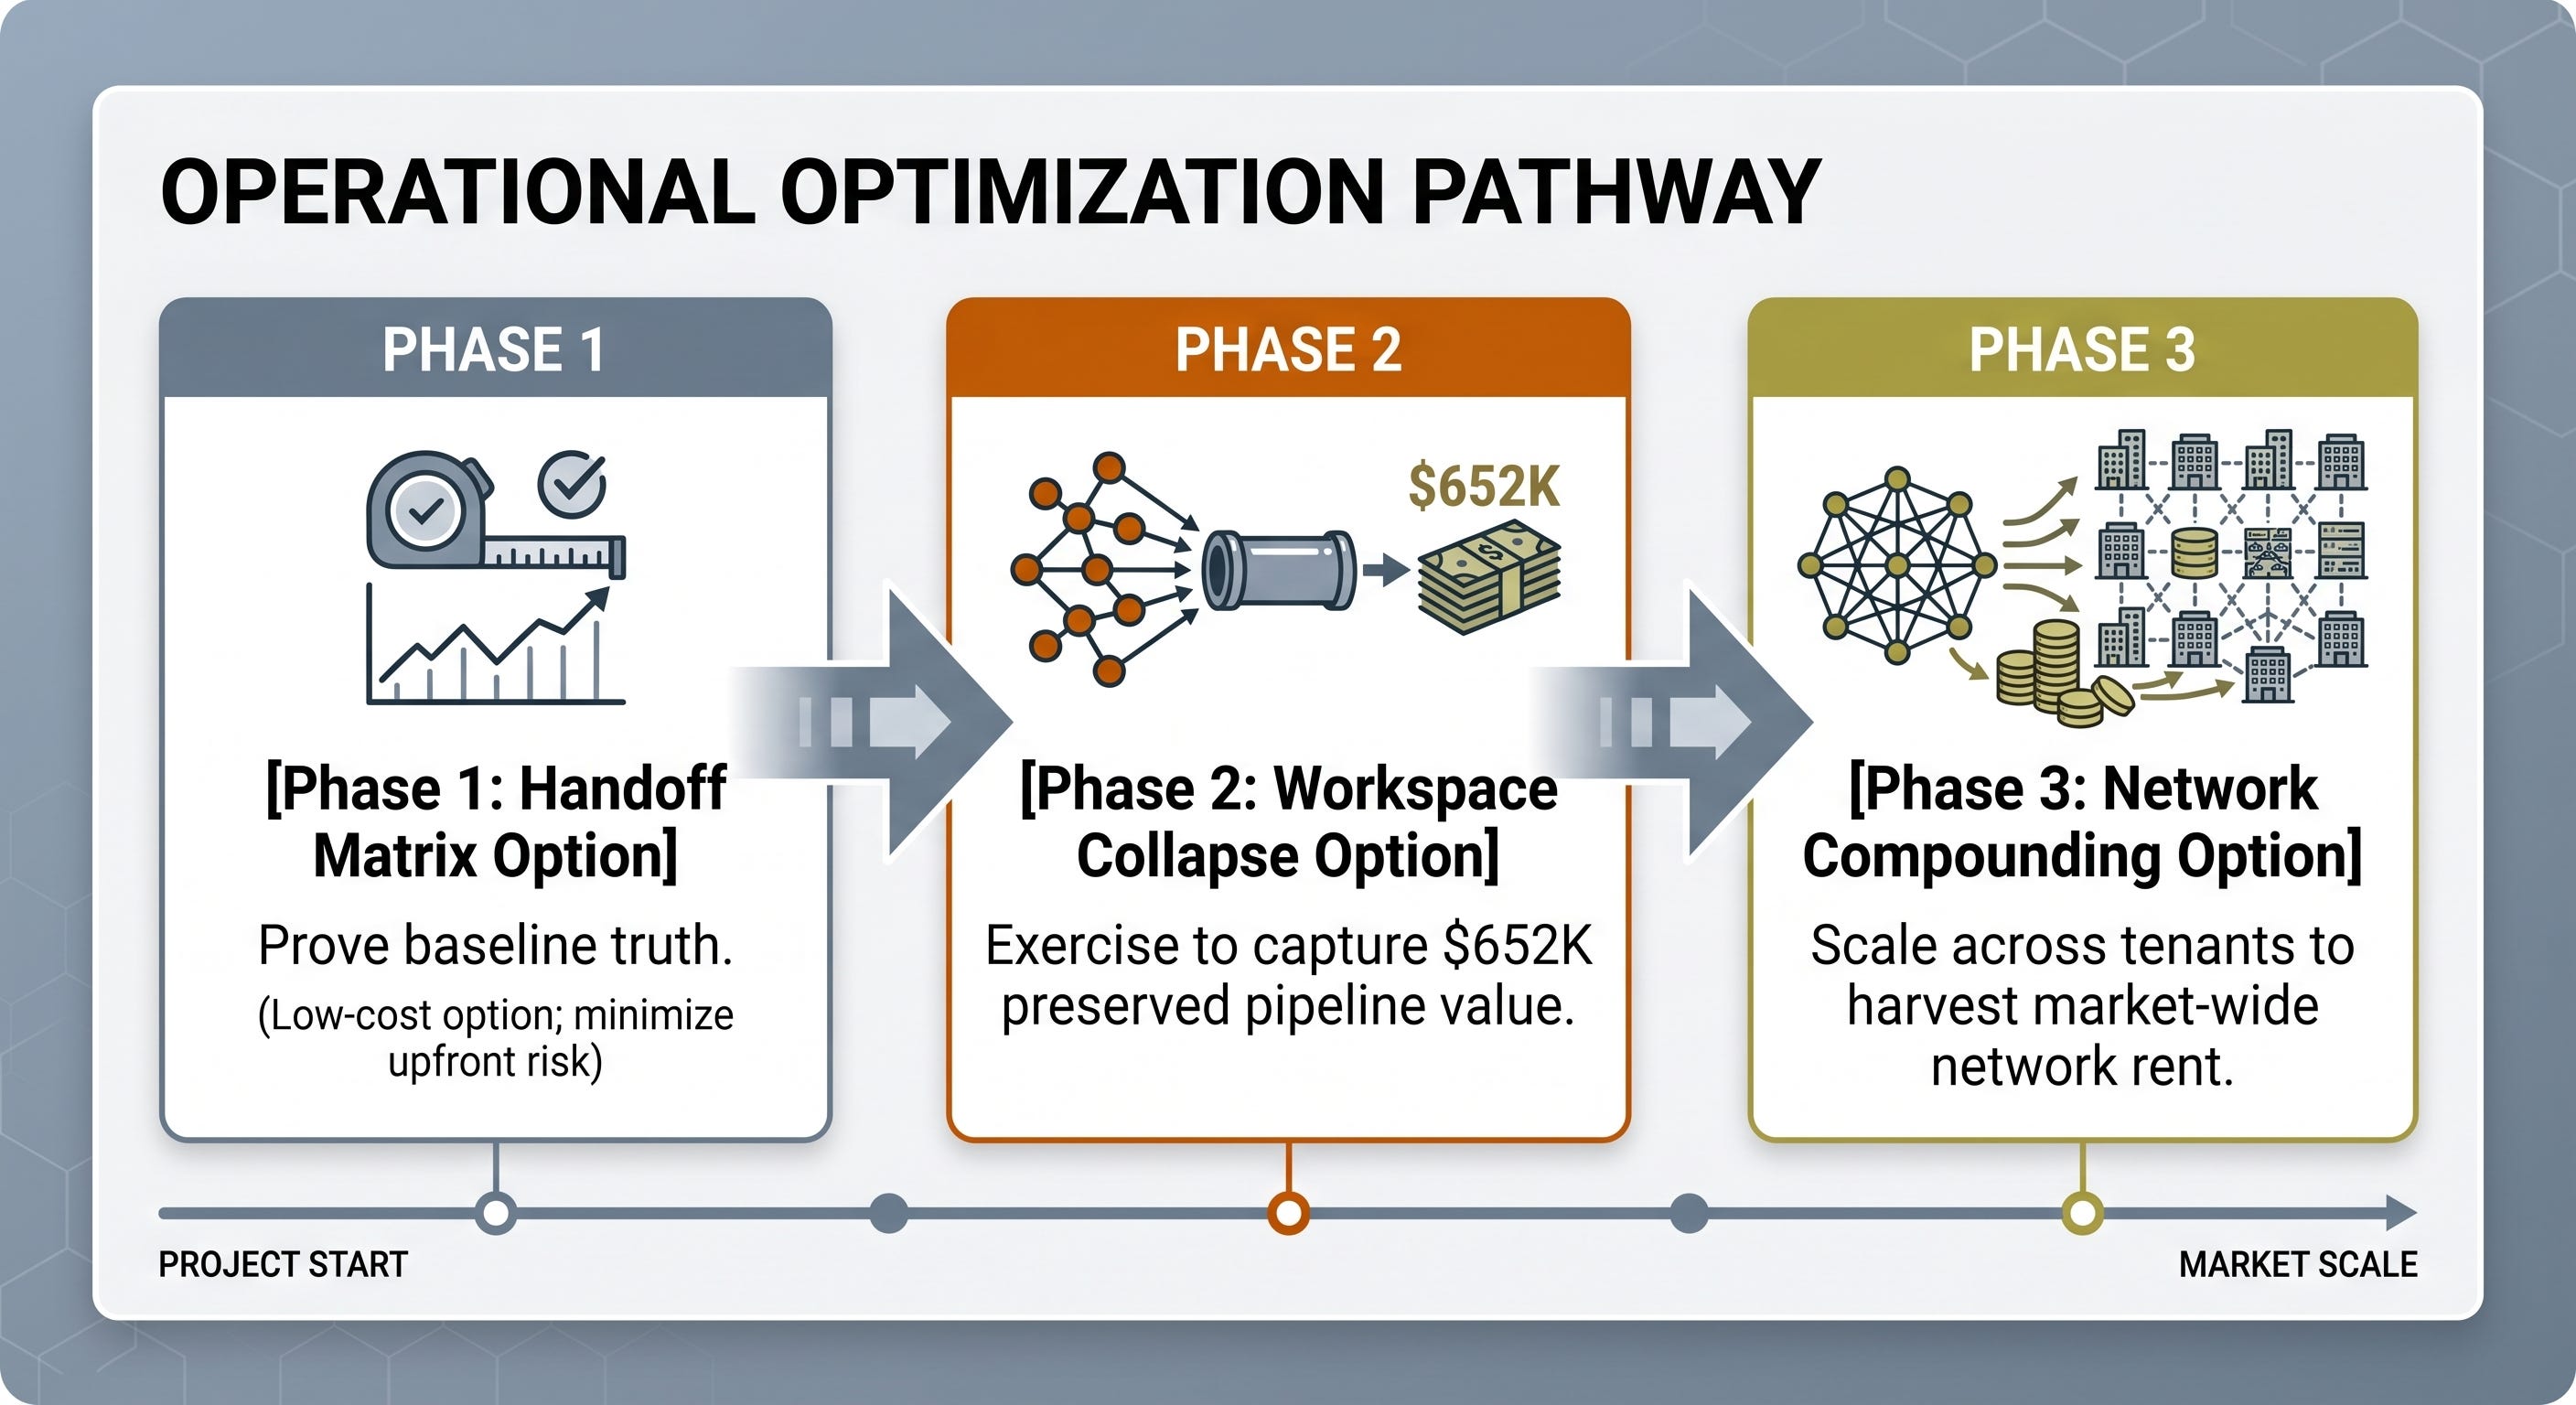
This phased options structure creates an ironclad downside protection shield. If a regulatory mandate shifts or an automated intersection fails to deliver, the option can be immediately abandoned at the 90-day mark for near-zero capital loss.
By replacing rigid software deployment roadmaps with an agile, evidence-backed options portfolio, operations leaders gain a critical advantage: they acquire the structural flexibility needed to manage massive volume volatility without locking the enterprise into permanent, inflexible headcount liabilities.
The Strategic Path Forward
The evidence compiled across these ten takeaways points to a singular, undeniable conclusion: the standard playbook for healthcare interoperability is broken because it seeks to optimize inside departmental silos rather than deleting the data layer of the silos themselves.
By shifting your operational strategy from a mindset of sustaining efficiency additions (Pathway B) to one of disruptive structural subtraction (Pathway C), you stop playing the legacy software game entirely. You become the neutral arbiter of operational truth, driving your transaction costs to the physical minimum while capturing substantial strategic value along the way.
As you reflect on your organization’s current digital transformation roadmap, ask yourself one final, fundamental question:
Are the tools you are purchasing this quarter designed to dissolve your administrative friction, or are they simply helping your team paddle faster inside an expensive, artificial swamp?
Accelerate Your Operational Architecture
Ready to pressure-test these first-principles math models against your own enterprise numbers? Click the links below to access the interactive tools, converse directly with the automated domain expert.
Launch the Interactive NotebookLM Oracle Analytics Dashboard
Is your organization interested in true innovation? Or does it prefer to just look busy and hire consultants? The world is changing quickly. If you’re not adapting to it, you’re not innovating. I work with organizations who are serious about attacking problems and who are tired of defending the current paradigm. Is that you? (my availability is limited).
Submit a problem or challenge: Click here
Book an appointment: Click here
Email me: mike@pjtbd.com
Call me: +1 678-824-2789
Join the community: Click here
Follow me on 𝕏: https://x.com/mikeboysen
Articles - jtbd.one - De-Risk Your Next Big Idea
Always attack…Never defend