

Resarch Note
I’ve done several research studies in the Enterprise SaaS domain and I’ve found a common problem that is not being addressed by any of the initiatives I’m tracking this across those companies. Decision Latency.
This is the obvious outcome everyone needs to focus on.
But, what is the not so obvious solution?
I show you where I see the problem, and I provide a clear solution category and architecture. For customers, this is industry-agnostic.
It’s not comfortable, but I defend my position against all of the challenges. Watch the video. I’ve provided detail below for those that are struggling. I’ve got the entire strategy ‘proof’ available as an oracle. I won’t share those publicly any longer; but they have the detail you would need to perform final validation as well as an outcome-based (user story) roadmap.
Obviously, these can be scoped to very specific problems. This is one is fairly broad — but highly relevant.
The claim: Cycle-time compression claims are unverifiable until arrival rate is separated from wait time at each decision boundary; the measured cost of one material operational commitment is $1,898.97 against a $1.65 physics-floor cost, a 1,149.01x gap.
For the Chief Operating Officer, this unmeasured friction represents $44.5 million in annual operational waste per internal business unit this year. At 23,474 material commitments per unit and 75 units, the modeled operating leak scales to billions before any platform fee is applied.
Incumbents will say “embed agents and automate the sense-decide-act loop.” What is actually true is that the dominant cost sits in human deliberation and handoff time that never appears on a vendor invoice, while cross-system propagation remains seconds to tens of seconds with eventual consistency.
FACT from the cost model and physics-floor calculation.
FACT from the empirical reconstruction data (26 analyst hours for the first trace, 41 percent incomplete packages, 19 percent handoffs without a named acceptor).
ASSUMPTION that high category CAGRs persist and that competitor agents will pay external tolls.
HUNCH that 10x lifts are achievable before irreversible capital is committed.
Refuse scale capital until a frozen local baseline shows at least a 2x lift in audit-clean material loops per fully-loaded dollar at 90 days; otherwise kill the intervention and instrument the dominant boundary first.
The first trace reconstruction on a 1,800-case payment-integrity remediation program took 26 analyst hours. A defensible four-week local baseline required 180 internal hours and cost $31,000. Pre-legal transit averaged 5.7 days while legal deliberation averaged 2.9 days; after a local change, treasury-operations wait rose from 5.0 days to 6.4 days.
Forty-one percent of packages were initially incomplete. Nineteen percent of handoffs lacked a named acceptor. The program carried $6.8 million in gross exposure against $2.1 million in verified expedited valid recoveries.
These numbers are the operating reality a COO can take into a meeting without further framing.
Unmeasured Boundary Queues Make Every Throughput Claim Unauditable
Without boundary-level arrival and wait timestamps, observed cycle-time reduction cannot be distinguished from lower arrival volume or constraint migration. Little’s Law states that long-run average inventory equals arrival rate times average time in system: L = λ * W. The identity holds for any stable queue. Applied to high-stakes operational commitments, λ is the rate those commitments enter the operating system and W is total time inside it. If W is observed but λ is not, a shorter calendar cycle can be produced simply by admitting fewer items. If neither per-boundary arrival nor per-boundary wait is recorded, the operator cannot decompose W into processing time versus queueing and handoff time.
FACT: The governing first principle and the requirement for timestamped arrivals, processing, waiting, and handoffs are direct consequences of the conservation identity.
FACT: Empirical reconstruction of one commitment class required 26 analyst hours for the initial trace and 180 hours plus $31,000 for a four-week frozen baseline that captured arrivals, median and P90 waits, service time, backlog, rework, exceptions, case mix, and evidence completeness.
ASSUMPTION: That most material decisions currently complete at roughly one per week while machines execute hundreds per second; the two figures measure different units and no standardized public measurement of “material decision” rate exists.
The empirical record shows the measurement problem is immediate and expensive. In the payment-integrity program, 38 percent of proposed items were classified as exempt, duplicate, or immaterial, consuming 640 staff hours before the 90-day commitment even began. Forty-one percent of packages arrived incomplete, generating downstream clarification and resubmission. Nineteen percent of handoffs lacked a named acceptor; nine cases waited 3.7 days for ownership determination. Pre-legal transit of 5.7 days dwarfed 2.9 days of actual legal deliberation, then the constraint migrated: legal wait improved while treasury wait rose from 5.0 to 6.4 days. One case required 74 hours simply to validate the intervention against its own acceptance criteria.
The second-order cost is that every subsequent claim of “throughput up” becomes unauditable. Without the frozen baseline and the boundary decomposition, a local improvement can be declared while the same delay reappears one interface downstream. Incumbent systems of record instrument their own objects—CRM records, workflow tasks, purchase orders, HR transactions—never the cross-system human decision loop. The labor pool that sits between those systems (meeting hours, analyst reconciliation, approval-queue wait, exception triage) is org-chart resident and therefore invisible on any vendor dashboard.
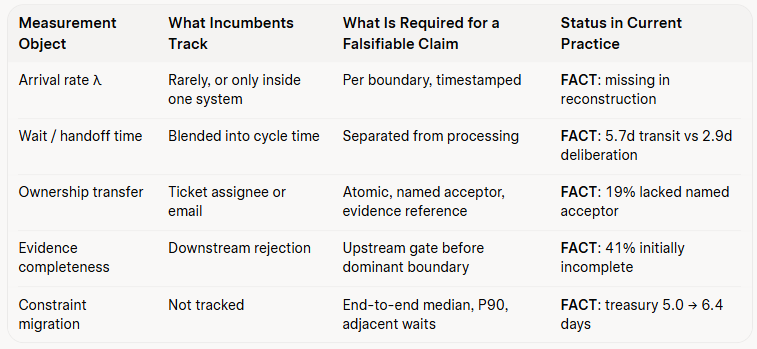
The validation gate on the full hypothesized friction surface returned only 13 percent verification. Many steps in the chronological job map, including full queue-evidence capture at every boundary and pre-registered acceptance criteria for verified throughput gains, were marked missing. The usable empirical base rests on a handful of substantive interviews from insurance and commercial banking operations. That is enough to confirm that reconstruction is costly and that local optimization moves delay; it is not enough to claim the mechanism transfers to non-regulated back-office work.
The 1,149x Gap Is Structural Boundary Friction, Not a Labor-Cost Curve
The $1,898.97 current cost per material commitment versus the $1.65 physics floor is produced by coordination layers that add no independent control authority, not by the irreducible cost of judgment. Labor across seven tasks totals $1,482. Other numerator resources (orchestration allocation, SaaS seats, synchronization, rework, compliance) add $416.50 plus a small data-movement share, for a numerator of $1,898.97. The denominator comprises marginal compute, inference, regulatory floor, and residual agent labor totaling $1.65. The resulting N/D ratio of 1,149.01x clears the structural-inversion band for bits-and-labor processes.
FACT: These component costs and the 1,149.01x ratio are the output of the calibrated cost model. Annual waste per internal business unit is approximately $44.5 million at the stated volume of 23,474 material commitments.
ASSUMPTION: That the software envelope and rework multiplier used in calibration accurately represent any given enterprise; rates were bracketed from public ranges and mandated pipeline costs.
HUNCH: That the full gap can be closed by agentic loops before irreversible capital is spent; no clean cross-industry measurement of sense-decide-act-learn at that magnitude with hard kill gates exists.
The labor breakdown itself reveals the structure. Intake and normalization, record retrieval across systems (two instances), reconciliation, decision-brief preparation at a $300 rate, coordination and escalation (two instances), review and approval at a $750 rate, and completion verification (two instances) sum to the $1,482. The largest single line is the 0.7-hour review at $750, but the volume of lower-rate retrieval, coordination, and verification work dominates the hours. Rework is modeled at 22 percent and absorbed into the rework-prone steps. Abandonment sits at the same 22 percent rate: commitments that never close cannot contribute to any throughput metric.
Industry data reinforce that productivity and outcome velocity are not the same thing. McKinsey’s survey found 80 percent of respondents reporting AI improved individual productivity while only 37 percent attributed any EBIT impact. Workday data showed roughly 37 percent of AI time savings eroded by review and revision of outputs. Coordination and interface latency in typical workflows runs 9–36 times actual processing time. Gartner projects 40 percent of enterprise applications will embed task-specific agents by the end of 2026, yet also flags that more than 40 percent of agentic projects may be cancelled by the end of 2027 for poor data quality, unclear ROI, and inadequate governance.
The non-obvious implication is that adding capacity or agents to non-binding steps increases volume without reducing the binding wait. Decision Intelligence market revenue continued to rise while year-over-year growth decelerated from 21.29 percent in 2023 to 18.61 percent in 2024 and 16.68 percent in 2025. Absolute dollars climbed; the category stall is indigestion, integration drag, and buyer fatigue. Suite owners embed agents inside installed bases (per-conversation metering, embedded copilots, platform-native assistants), raising switching costs. A standalone layer that does not own a scarce, co-signed verification artifact at the boundary simply competes on the same shelf.
The North Star metric that makes the gap visible is Decision Loop Economics: audit-clean material loops closed divided by fully-loaded loop cost (loaded labor + agent-run credits + incremental integration amortization). A loop counts only if it crosses at least one system-of-record boundary, passes timestamped sense-decide-act-learn gates, carries logged human authorization at the decide gate, and survives 90-day post-decision audit without material disagreement. Materiality is anchored at greater than 0.25 percent TTM EBITDA variance. At least 60 percent of headline savings must come from human-effort removal; vendor-cost share is bounded below 35 percent. Cycle-delay opportunity cost is reported separately and excluded from the binding denominator.
Baseline construction requires a qualitative value calculator with the CFO or COO, a two-week decision autopsy on 20–30 retrospectively sampled loops, 90-day outcome KPIs, and co-signature of the baseline before any intervention. No signature, no metric. The 90-day audit-clean binary and the exogenous materiality threshold are the protections against Goodhart effects and venture bias in scope selection.
Elasticity of 1.38 Turns Local Efficiency into Rebound Unless the Binding Constraint Is Inverted
When the Jevons Elasticity Factor is 1.38, efficiency gains at a non-binding boundary increase arrival volume faster than cost falls, migrating the constraint and erasing the operating dividend. The factor was scored across six structural dimensions (regulatory constraint, substitution availability, infrastructure lock-in, budget flexibility, time sensitivity, network effects) at an intermediate rubric of 2.60 out of 4.00. Demand is classified highly elastic; the paradox applies. Cheaper unit economics unlock more multi-step workflows, more experimentation, and deeper embedding; token volumes and enterprise AI spend have already demonstrated the pattern.
FACT: E = 1.38 and the associated dimension scores are the output of the elasticity model.
FACT: Empirical constraint migration (legal wait down, treasury wait 5.0 to 6.4 days) occurred inside the studied program.
ASSUMPTION: That the same elasticity will govern every commitment class; the scoring used dossier-derived counts of constraints, competitors, and growth rates.
HUNCH: That most organizations currently complete one material decision per week; the figure is directional contrast, not a standardized measurement.
The practical consequence is that a sustaining layer—copilot wrappers, evidence summarizers, priority nudges—can reduce apparent friction while stimulating additional commitments and exceptions. Volume response can be represented as Volume response index = E * Productivity-induced capacity release. At E greater than 1.0 the induced throughput expands faster than the initial efficiency gain. Path B-style queue-control tools remain useful as a funding and trust bridge only if they are deliberately engineered to surface orphaned capacity and to fund the deeper inversion rather than become a permanent destination. Otherwise the next human reviewer or compliance officer simply absorbs a higher arrival rate.
The structural correction required by both the 1,149x gap and the elastic regime is inversion of the boundary mechanics themselves: one named accountable owner and measurable transfer condition per cross-functional boundary, atomic custody (role-level acceptance, timestamp, evidence reference, next action, exception state), and deletion of layers that restate an upstream decision without adding independent control authority. Capital is staged as real options. The first option buys the frozen baseline and the dominant-boundary map. The second funds a bounded concierge intervention on one commitment class with pre-registered median, P90, rework, control, deadline, and case-mix criteria. Expansion capital is released only when the target boundary’s wait-time share falls, cohort drift stays inside tolerance, and downstream queues do not absorb the released capacity. P90 failure, material control findings, or case-mix drift are halt-and-diagnose events.
Physics and regulatory facts constrain the architecture. Sub-second verified propagation across independent SaaS clouds violates distributed-systems latency floors; cross-system movement must be modeled in seconds to tens of seconds with eventual consistency and compensating transactions. Async log observers cannot enforce synchronous transactional guarantees. Hardware diodes cannot carry bidirectional CRM-ERP handshakes. Cross-tenant SOX evidence co-deposition is not valid ICFR evidence. Direct binlog CDC against multi-tenant SaaS backends is an architectural assumption, not a given; vendor-published events and webhooks with explicit rate limits are the available substrate. These facts block any claim of instantaneous, atomic, multi-vendor decision loops.
The expensive surprise is that the measurement artifact itself—the co-signed arrival-and-departure record that both releasing and receiving owners attest—becomes the scarce verification object incumbents structurally refuse to build. Salesforce will not bridge to SAP at the decision-loop level; ServiceNow will not bridge to Workday. The metric is the proxy; the bridge is the moat. Once that object exists, wait-time share can be calculated deterministically as observed wait divided by elapsed time since arrival, ranked without subjective importance scores, and guarded by cohort-fingerprint comparison. A provisional ranking released without an active lock, or a gain claim whose cohort has drifted, is refused rather than published.
Appendix: If You Want the Math
If the binding constraint can migrate from legal to treasury inside a single program while both the gross exposure and the verified recovery remain unresolved, what evidence standard would you require before releasing the next tranche of automation capital?
Book an appointment: Click here
Email me: mike@pjtbd.com
Call me: +1 678-824-2789
Follow me on 𝕏: https://x.com/mikeboysen
Articles - jtbd.one - De-Risk Your Next Big Idea
Website - pjtbd.com
Slaying the Sacred Cows of Innovation


