

Introduction: The Innovation Blind Spot
Imagine the boardroom of a company we'll call "InnovateCorp." The air is thick with the smell of dry-erase markers and lukewarm coffee. The Head of Innovation stands before the executive team, clicking through a slide deck filled with impressive-looking charts.
"As you can see," she says, pointing to a rising bar graph, "our R&D spend is up 15% year-over-year. We've filed 42 new patents, and our idea pipeline has over 500 employee submissions. By all traditional measures, our innovation engine is firing on all cylinders."
The CEO nods, a flicker of uncertainty in his eyes. The numbers look good. The activity is undeniable. But the company’s market share is stagnant. A nimble startup just ate into their most profitable segment. The last "blockbuster" product launch fizzled out, barely earning back its marketing budget. The activity in the boardroom feels disconnected from the reality in the market.
This scene plays out every single day in thousands of companies around the world. It’s a performance. A ritual. It’s what I call "Innovation Theater."
You're likely familiar with it. You're measuring things that are easy to count, not the things that actually count. You're flying your multi-billion dollar enterprise using a dashboard of rearview-mirror metrics, celebrating the road you've already traveled while remaining completely blind to the hairpin turn just ahead.
You have an innovation blind spot. And it’s going to kill your company’s growth.
The core problem is that you’re measuring activity, not capability. You’re measuring inputs (money spent) and outputs (patents filed), but you have no reliable way to measure your actual, latent potential to create what customers will pull from your hands, wallets open, with zero persuasion. You have no leading indicator of future success.
Until now.
This article isn't about a new dashboard or a complex algorithm. It's about a fundamental shift in perspective. I'm going to show you how to deconstruct the very idea of "innovation measurement" and rebuild it from first principles. I will reveal the one "metric"—a concept that is far more powerful than the popular (and flawed) formulas you may have heard of—that acts as a true leading indicator of innovation potential.
It will give you a map to future value creation. It will expose the hidden goldmines of opportunity in your market. It's the compass that will guide you out of the Innovation Theater and toward predictable, sustainable growth.
Part 1: Deconstructing the Great Failure of Traditional Innovation Metrics
Before we can build a new model, we must first demolish the old one. For decades, business schools and boardrooms have clung to a holy trinity of metrics that are not just flawed, but actively misleading. They create the illusion of progress while obscuring the reality of stagnation. Let's pull them apart, piece by piece.
The R&D Spending Fallacy: The Myth of Buying Your Way to Breakthroughs
This is the metric leaders love to tout in annual reports. "We invested $500 million in R&D this year!" It sounds impressive. It implies a deep commitment to the future. But it's a trap.
The brutal truth is that there is no meaningful correlation between the amount of money a company plows into its research and development and its ability to successfully innovate.
Think about it. Xerox's Palo Alto Research Center (PARC) in the 1970s was one of the most well-funded and brilliant R&D labs in history. They invented the graphical user interface (GUI), the computer mouse, and ethernet networking. Their spending was enormous. Yet, it was a young, scrappy company called Apple, spending a fraction of the amount, that successfully commercialized the GUI and mouse to launch the Macintosh, changing the world in the process.
Xerox measured the input (R&D spend) and failed. Apple focused on the right problem and succeeded.
Clinging to R&D spend as a measure of innovation capability is like judging a chef's skill by the cost of their ingredients. A great chef can make a masterpiece from simple, inexpensive components, while a terrible one can ruin the most luxurious ingredients. The spending itself tells you nothing about the capability to create a delicious meal.
Your R&D budget is a measure of effort, not effectiveness. It's an investment, but without a target, it's just a cost. It’s the innovation equivalent of buying a lottery ticket—you've spent the money, but you have no greater chance of winning than you did before.
The Vanity of Volume: Why Patents and Idea Counts Are Dangerous Distractions
This is the favorite metric of middle managers. It's the "look how busy we are!" metric. An internal portal overflows with thousands of employee ideas. The legal department proudly announces a record number of patent filings. Everyone gets a pat on the back.
But this is pure vanity. It’s a measure of activity, not progress.
Let's talk about ideas. Your company doesn't have an idea problem. It has a prioritization problem. Having 1,000 ideas in a database is useless if you don't know which one solves a real, urgent, and underserved customer problem. In fact, it's worse than useless—it's a massive distraction. It creates organizational churn as teams debate the merits of hundreds of solutions without ever agreeing on the problem they're supposed to be solving.
And patents? The vast majority of patents are purely defensive. They are legal chess moves designed to block competitors or use as leverage in litigation. Most never see the light of day as a commercial product and generate zero revenue. Companies like IBM have historically topped patent filing lists for years, but this hasn't always translated into market-defining product innovation during those same periods.
Focusing on the volume of ideas and patents is like judging a novelist's talent by the number of words they type per day. It’s a flurry of motion that signifies nothing about the quality of the story being told.
The Trap of Lagging Indicators: How New Product Revenue Looks in the Rearview Mirror
This is the most deceptive metric of all because it feels so tangible. "35% of our revenue this year came from products launched in the last three years!" The executive team breathes a sigh of relief. "See? We are innovative!"
But you're not. You're just measuring the echo of past successes.
Revenue from new products is a quintessential lagging indicator. It tells you, with certainty, about a bet that paid off one, two, or even five years ago. It tells you nothing about the health of the system that will produce the next winner.
Consider Research in Motion (RIM), the makers of BlackBerry. In the late 2000s, their revenue from new devices was staggering. Their metrics looked fantastic. But those numbers completely blinded them to the fundamental market shift initiated by the iPhone. The iPhone wasn't just a new product; it was a new platform that solved a higher-level job for customers. By the time BlackBerry's lagging indicators started to plummet, it was already too late. The game was over.
Your revenue from new products is a report card on your history, not a strategy for your future. Celebrating it as a sign of current innovation capability is like driving down the highway at 80 miles per hour by looking only in the rearview mirror. The view is crystal clear, but it's of a road you can no longer change.
Part 2: A First-Principles Shift: Redefining "Capability" Through the Customer's Job
If the old metrics are broken, where do we turn? We go back to the beginning. We use First Principles Thinking.
This is the mental model famously used by innovators like Elon Musk. Instead of reasoning by analogy ("This is how other car companies build batteries"), you break a problem down into its most fundamental, undeniable truths and then reason up from there.
When Musk wanted to build rockets, he didn't accept the analogy that "rockets are expensive." He broke the rocket down to its first principles: What are the raw materials? Aerospace-grade aluminum alloys, titanium, copper, carbon fiber. He calculated the cost of those materials on the open market and found they were only 2% of the typical price of a rocket. The "truth" wasn't that rockets were expensive; it was that the methods of building and discarding them were expensive. Reasoning up from that fundamental truth led to the breakthrough of reusable rockets at SpaceX.
So, let's apply this to our problem. What is the first principle of innovation capability?
Assumption: Innovation is about creating new products. (False)
Assumption: Innovation is about new technology. (False)
Assumption: Innovation is about creativity and ideas. (Incomplete)
Let's break it down further.
Why does a company innovate? To create value.
How is value created? By solving a problem for a customer.
What is a problem? It's a gap between a desired state and a current reality.
What is a customer trying to do when they experience this problem? They are trying to make progress in some aspect of their life.
This brings us to the fundamental, irreducible truth—the first principle of innovation:
Value is created when you help someone make progress.
This is the bedrock. This is the simple, powerful idea behind the Jobs-to-be-Done (JTBD) theory. Popularized by the late, great Clayton Christensen, JTBD proposes that customers don't "buy" products. They "hire" them to get a job done.
You don't buy a lawnmower. You hire it for the job of maintaining an orderly home exterior. This job has functional dimensions (cutting the grass to a uniform height), but also emotional and social ones (feeling a sense of pride in your home, being perceived as a responsible neighbor).
You don't buy a cup of coffee. You might hire it for the job of increasing mental focus to start the workday (functional), or you might hire it for the job of facilitating a social connection with a friend (social). The product is the same; the job is completely different.
This shift in perspective is everything. It takes the focus off of your product and puts it squarely on your customer's struggle and desired progress. And here is the key: while products, technologies, and solutions are transient, the underlying Job-to-be-Done is remarkably stable over time. People have been trying to "share information across distances" for centuries. The solutions evolved from couriers to telegraphs to telephones to email, but the core job remained.
So, if we accept this first principle, our definition of innovation capability must change.
True innovation capability is the organizational ability to systematically and predictably identify and solve a customer's Job-to-be-Done better and/or more affordably than any other alternative.
This is our new foundation. It’s not about your ideas, your spending, or your patents. It’s about your organization's proficiency at understanding and solving your customer's job. This is something we can measure. And the process for doing it is called Outcome-Driven Innovation (ODI).
Part 3: Unveiling the "One Metric": A Critical Look at a Flawed Formula and a Better Way Forward
We've established that to measure our innovation capability, we must measure our ability to help customers get their job done better. This requires knowing how they measure success. For years, a popular metric known as the Opportunity Score has been promoted as the way to do this.
The premise is enticing: survey customers on the importance of their needs and their satisfaction with current solutions, plug the numbers into a formula, and reveal the biggest opportunities for innovation. The most common formula, used for decades, is:
Opportunity Score = Importance + max(Importance - Satisfaction, 0)
At first glance, this seems logical. It gives extra weight to importance and highlights gaps where importance is greater than satisfaction. For a long time, this was considered a useful tool.
But here's the dirty little secret that data scientists and survey gurus have come to realize:
this formula is broken.
It's a popular tool that has served a purpose, but through real-world application, critical flaws have surfaced that can lead your entire strategy astray. Let’s look at the evidence.
How to Use the Opportunity Score to Prioritize Your JTBD Product Roadmap

If you'd like to dive really deep into the flaws of the Opportunity Score and several alternative ranks approaches, this is what need to read.
The Four Critical Flaws of the Traditional Opportunity Score
The Formula is Biased and Distorts Reality
The Opportunity Score algorithm has a built-in bias that significantly skews results. By using "Top 2 Box" percentages (counting only those who respond 4 or 5 on a 5-point scale) and double-weighting importance, it doesn't treat all customer feedback equally. Imagine each customer casting a vote. This formula effectively allows some customers to vote three times, while others don't get a vote at all. This misrepresents the true landscape of what the total market actually needs.
The Formula Incorrectly Prioritizes Needs
This is the most dangerous flaw. The common wisdom is that a score above 10 indicates an underserved need and a top priority. However, this is dangerously misleading.
The formula can produce a high score for a need that is only important to a small number of people, while producing a lower score for a need that is underserved for a much larger group. Here’s a clear example:
**Desired Outcome A:** Scores a **12**, but the underlying data shows only **20%** of customers are actually underserved.**Desired Outcome B:** Scores a **10**, but the data shows that **50%** of customers are underserved.
The traditional formula tells you to focus on Outcome A. But which is the better predictor of a true market opportunity: an abstract score of 12, or the fact that
half your market is struggling with Outcome B? The formula can mislead you into thinking needs are equally underserved when they are not, confounding your entire innovation strategy.
The Formula Amplifies Statistical Error
Any survey data based on a sample of a population has a margin of error. However, the Opportunity Score formula is particularly susceptible to this problem because it's impacted by sampling error three times: twice for the importance score and once for the satisfaction score.
With a small sample size, the margin of error can be as high as ±5.4. This means a calculated score of 10 could, in reality, be anywhere from 4.6 to 15.4. How can you make confident, multi-million dollar investment decisions based on a metric with that much guesswork?
The Formula is Difficult to Interpret
Finally, for a metric to be useful, it must be easy for stakeholders to understand and act upon. The Opportunity Score fails this test spectacularly. It is not intuitive and requires a lengthy explanation to compensate for its multiple issues. When you show an executive a scatter plot of these scores, all they see are dots on a plot. It is far from ideal for quick, informed decision-making.
The Real Metric: The Percentage of Underserved Customers
So, if the old formula is broken, what do we replace it with? We replace the complex and abstract with the simple and direct.
The one metric that truly reveals your innovation potential is the Percentage of Underserved Customers for a given desired outcome.
This is the number that matters. "What percentage of our market considers this outcome to be highly important, but are highly unsatisfied with their current ability to achieve it?" Answering this question is the key.
Instead of a flawed algorithm, you use a more transparent and statistically sound approach, like the "Percentages and Ranks" method. This method works by:
Defining "underserved" for each individual customer (e.g., they rate an outcome's importance a 4 or 5 and their satisfaction a 1, 2, or 3).
Simply counting the percentage of your total survey respondents who fall into that "underserved" category for each specific outcome.
Ranking the outcomes based on this clear, intuitive percentage.
This approach gives you a direct, defensible, and easily understood measure of market opportunity. A need for which 50% of your customers are underserved is clearly a bigger opportunity than one where only 20% are underserved. It aligns your innovation efforts with the biggest pockets of customer struggle, which is the most reliable path to growth. This is the evidence-based approach needed for making transformational financial investment decisions for your enterprise.
Part 4: From Metric to Moat: Building a Future-Proof Innovation Engine with the 10 Types of Innovation
So, you've used a reliable method to analyze your market. You now have a ranked list of desired outcomes based on the percentage of customers who are underserved. Let's say your #1 opportunity is: "Minimize the time it takes to prepare a healthy meal."
Now what?
The amateur innovator's first instinct is to say, "Okay, let's build a new, faster cooking appliance!" This is a failure of imagination. A high-priority unmet need doesn't just point to a product idea; it points to a value creation opportunity that can be captured in many different ways.
To build a truly defensible competitive advantage—a deep moat—you need to think beyond the product. This is where we integrate the Doblin 10 Types of Innovation framework. This framework gives you a strategic palette to choose from when deciding how to solve the customer's unmet need.
The 10 Types are grouped into three categories:
Configuration (How your company operates): Profit Model, Network, Structure, Process.
Offering (What you produce): Product Performance, Product System.
Experience (How you connect with customers): Service, Channel, Brand, Customer Engagement.
Let's use our high-priority outcome—Minimize the time it takes to prepare a healthy meal—and see how we could solve it using different types of innovation.
Product Performance (The Obvious One): You could create a new "smart oven" that uses AI and new heating technology to cook food 50% faster than any other appliance on the market.
Product System: You could create a system of complementary products: pre-chopped, pre-marinated meal kits that are designed to be used exclusively with your new smart oven for perfect results every time.
Process (Internal Focus): You could develop a radically efficient, automated process for producing and delivering fresh meal kits, allowing you to operate at a lower cost than competitors like Blue Apron or HelloFresh.
Service: You could offer a premium subscription service where a nutritionist plans your weekly meals based on your health goals, and the corresponding meal kits are automatically delivered. The service is the innovation.
Channel: You could bypass grocery stores entirely and install refrigerated vending machines in gyms and office buildings that dispense your healthy meal kits, making them available exactly where and when your customers need them.
Profit Model: You could sell the smart oven at a loss (or give it away) and make all your profit from a high-margin subscription to the meal kits required to use it, similar to the Nespresso model.
Network: You could form an exclusive partnership with Weight Watchers or Peloton, integrating your meal planning service directly into their platforms and co-branding the offering to their massive user base.
Do you see the power now? The data told you what problem to solve. Doblin's framework gives you a strategic blueprint for how to solve it.
The strongest moats are built not by choosing one of these, but by combining them. Imagine a new Product System (meal kits and a smart oven) delivered through a novel Channel (refrigerated vending machines), powered by a proprietary Process (supply chain automation), supported by a premium Service (nutritionist planning), and funded by an innovative Profit Model (hardware-at-cost, subscription for consumables).
That is an innovation strategy that is incredibly difficult for a competitor to copy. It all started from one data-driven metric: the percentage of customers who are underserved.
Part 5: The Future of Getting the Job Done: Novel Concepts and Higher Levels of Abstraction
A clear, ranked list of unmet needs is your guide to winning in the current market. But what about creating the next market? How do you find the opportunities that lead to true disruption?
The key is to elevate the level of abstraction of the Job-to-be-Done.
The customer's job isn't really "prepare a healthy meal." That's a solution-centric view. Why are they preparing a healthy meal? To manage their physical health. Why are they managing their health? To live a longer, more fulfilling life.
Each "why" elevates the job to a higher context.
Level 1: Prepare a healthy meal.
Level 2: Manage my physical health.
Level 3: Maximize my long-term well-being.
Innovating at Level 1 helps you build a better meal kit. Innovating at Level 3 could lead you to create a personalized preventative medicine platform that makes reactive meal prep less necessary. This is where truly transformative ideas are born. These future solutions often get a higher-context job done with a simpler tool, for a new type of job performer, at a lower cost, and with fewer visible features.
Let's explore some novel concepts for the higher-level job of "Manage my physical health."
What's working today that few are doing:
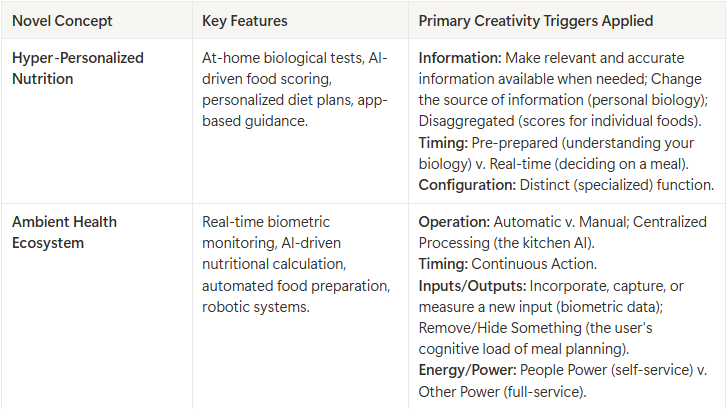
Concept: Hyper-Personalized Nutrition Subscriptions.
How it gets the job done differently: Companies like ZOE in the UK are moving beyond generic dietary advice. They start with at-home gut microbiome and blood sugar tests. Based on your unique biology, their AI platform gives you personalized food scores for thousands of foods. The job is no longer "prepare a healthy meal" (which is generic), but "prepare the optimal meal for my body."
Why it's better: It gets the job of "managing physical health" done with much higher precision. It is a simpler tool (an app providing information) that radically changes how the user interacts with the entire food ecosystem. It gets the job done completely differently and better.
Novel concepts for the future:
Concept: The "Smart Kitchen" Ambient Health Ecosystem.
How it gets the job done differently: This concept eliminates meal prep as a conscious task. Imagine a kitchen where sensors in your smartwatch or fitness tracker communicate your real-time biometric data (blood sugar, activity level, stress) to an AI. This AI controls a smart refrigerator and pantry that suggest and, in some cases, use robotics to prepare the nutritionally optimal meal for that exact moment. You don't decide what to eat; the system provides what your body needs, when it needs it.
Why it's a leap forward: It gets the job of "managing physical health" done automatically and in the background, dissolving the feature of "meal prep" entirely. The solution for the user is radically simpler: just eat. It is a higher-context solution for a new type of job performer (the AI assistant, not the human), getting the job done completely differently.
Part 6: A Practical Guide: Your New Strategy for Evaluating Innovation Capability
This all sounds powerful in theory. But how do you, a leader in your enterprise, actually implement this? Here is a practical, step-by-step guide to shift your organization from Innovation Theater to a data-driven engine of growth.
Step 1: Redefine Your Market (Around the Job, Not the Product)
Your first task is a strategic one. You must force your organization to stop defining its market by the product it sells and start defining it by the job the customer is trying to get done.
You are not in the "power drill" market; you are in the "home modification" market.
You are not in the "software" market; you are in the "improving team productivity" market.
Actionable Checklist:
[ ] Convene your leadership team.
[ ] Ask the question: "If our product disappeared tomorrow, what would our customers use instead?" This helps reveal the real job.
[ ] Ask "Why?" five times to move up the ladder of abstraction.
[ ] Formally agree on a single, stable, solution-agnostic definition of the core Job-to-be-Done you serve. This is your new strategic focal point.
Step 2: Execute ODI Research (Capture the Outcomes)
This is the research phase. You must conduct rigorous qualitative research with your customers to uncover their full set of desired outcomes for the job defined in Step 1.
Actionable Checklist:
[ ] Conduct 1-on-1 interviews with people who are getting the job done.
[ ] Focus the conversation on the process and struggles of the job, not on your product.
[ ] For each step of the job, listen for how they measure success.
[ ] Translate their statements into the precise
Verb + Metric + Object + Clarifierformat.[ ] Capture every single outcome statement. Aim for at least 100.
Step 3: Quantify and Prioritize Based on Underserved Needs
Now, you move from qualitative to quantitative. But you will do it the right way, avoiding the flawed formulas of the past. Your goal is to find the percentage of your market that is underserved for every outcome.
Actionable Checklist:
[ ] Create a survey instrument that lists all your desired outcome statements.
[ ] Field the survey to a statistically significant sample of your target market.
[ ] For each outcome, collect ratings on Importance and Satisfaction (typically on a 1-5 scale).
[ ] Analyze the results to calculate the percentage of respondents who rated an outcome as highly important (e.g., 4 or 5) BUT rated their satisfaction as low (e.g., 1, 2, or 3).
[ ] Rank your entire list of outcomes based on this percentage. This is your new, data-driven priority list.
Step 4: Audit Your Current Innovation Pipeline
With your reliable, data-driven map in hand, you must now hold a mirror up to your own organization.
Actionable Checklist:
[ ] Gather every single project currently in your innovation or R&D pipeline.
[ ] For each project, ask the ruthless question: "Which high-priority, underserved outcome on our ranked list does this project address?"
[ ] Be honest. You will likely find a horrifying disconnect. Most of your projects will be clustered around low-priority needs, because that's what your team knows how to do. You are likely ignoring the biggest areas of opportunity.
Step 5: Ideate Holistically (Use the 10 Types)
Now the fun begins. Your goal is to generate new ideas that are explicitly targeted at the top 5-10 outcomes on your new priority list.
Actionable Checklist:
[ ] Run ideation workshops focused only on a single, high-priority outcome.
[ ] Use the Doblin 10 Types of Innovation as brainstorming prompts. How could we solve this with a Process innovation? A Profit Model innovation? A Network innovation?
[ ] Encourage a portfolio of ideas—some small, some big, some combining multiple types of innovation.
Step 6: Measure and Track Capability
Finally, we close the loop. Your innovation capability is no longer an abstract concept. It is the measured alignment of your efforts to quantified customer needs.
Your New Capability Score: You can create a simple index. What percentage of your innovation budget is allocated to projects that directly address the top 20% of your prioritized underserved outcomes? Is that percentage going up or down over time?
Actionable Checklist:
[ ] Make your new ranked list of underserved outcomes the central document for all innovation funding decisions.
[ ] Mandate that every new project proposal must state which underserved outcome it targets and its expected impact on customer satisfaction for that outcome.
[ ] Review your portfolio against the ranked list quarterly. Kill projects that don't align. Double down on those that do.
Conclusion: Your Compass for Predictable Growth
We have traveled from the fog of Innovation Theater to the clarity of a data-driven strategy. We have deconstructed the flawed, rearview-mirror metrics of the past. We've exposed a popular but broken formula and replaced it with a simple, direct, and powerful compass: the percentage of customers who are underserved.
This is more than a metric; it's a mindset shift. It forces you to stop focusing on your own solutions and to start obsessing over your customer's struggles and desired progress. It transforms innovation from a gamble into a science.
Your company's true potential isn't hidden in a secret R&D lab or a pile of patents. It's written in the gaps between what your customers need to achieve and how well they can do it today. Your new, reliably-ranked list of unmet needs is the map to that potential. It is your guide to creating products and services that customers will want, to building competitive moats that rivals cannot cross, and to achieving the holy grail of business: predictable, sustainable growth.
Stop guessing. Start measuring what matters.
Thinking about your customers, what do you believe is the CORE "Job-to-be-Done" they are trying to accomplish? Share your initial thoughts in the comments—let's discuss!

Follow me on 𝕏: https://x.com/mikeboysen
If you'd like to see how I apply a higher level of abstraction to the front-end of innovation, please reach out. My availability is limited.
Mike Boysen - www.pjtbd.com
Why fail fast when you can succeed the first time?
My Blog: https://jtbd.one
📆 Book an appointment: https://pjtbd.com/book-mike
Join our community: https://pjtbd.com/join
