

The Deconstruction (The Skeuomorphic Trap)
The Great Skeuomorphic Lie (Reasoning by Analogy)
To understand why the current generation of cloud whiteboards—Miro, Mural, Lucidspark, and their myriad clones—are destined for the digital scrapheap, we must first use the Socratic Scalpel to excise the “Stuck Belief” that birthed them.
The collective hallucination of the SaaS industry is this: “Digital collaboration works best when it mimics a physical workshop.”
This is not a first principle. It’s a cultural artifact. It’s a textbook example of Reasoning by Analogy, the cardinal sin of innovation described in the Robust First Principles Analyst (RFPA) Protocol. When we reason by analogy, we look at what already exists (a physical whiteboard, a pack of 3M Post-it® notes, a Sharpie) and we ask, “How do we put this on a screen?”
The result is Skeuomorphism: the retention of essential ornamental design cues from physical structures that are no longer necessary in the digital medium. We saw this in the early iPhone, where the “Notes” app was textured like yellow legal paper and “Game Center” looked like a felt poker table. We eventually grew up and deleted those textures because they were inefficient.
Yet, in the realm of enterprise collaboration, we‘re still trapped in the “felt poker table” era. We’ve spent billions of dollars on venture capital to digitize the limitations of paper.
Let’s apply Command 1: Challenge the Requirements from the RFPA Protocol.
The Interrogation:
User Belief: “We need a digital sticky note tool so we can brainstorm like we do in the conference room.”
Socratic Inquiry (Category B - Challenging Assumptions): “What are you assuming here? You’re assuming that the physical constraints of a sticky note—its small size, its lack of connectivity, its ephemerality—are actually features of collaboration. Why must a digital thought be a 3x3 yellow square?”.
First Principles Reality: A physical sticky note is square because it is cut from paper stock. It’s yellow to contrast with white paper. It has limited text space because handwriting is large. It’s unconnected to other notes because it’s made of dead trees.
When you move to a digital environment, none of these constraints exist. Physics does not dictate that a “thought” must be a square vector graphic. Physics doesn’t dictate that data must be disconnected. By copying the sticky note, we’ve imported the Inefficiency of Atoms into the Efficiency of Bits.
This leads us to the Idiot Index calculation for the current whiteboard model.
Theoretical Minimum Cost: The transfer of a structured idea (Subject + Predicate + Object) from Brain A to Brain B. Time: Milliseconds. Format: Text/JSON.
Current Commercial Cost: A user logs in, waits for the WebGL canvas to load, selects a “pen” tool, draws a box, types text, resizes the box because the text didn’t fit, drags the box to align it with another box, changes the color to indicate “priority,” and then zooms out to find where their team went.
The Gap: We are expending massive computational and cognitive energy to simulate the friction of the physical world.
We’ve built a “Flufferbot”. Just as Tesla foolishly built a robot to move fiberglass fluff that shouldn’t have existed, we’ve built complex software to manage digital paper that shouldn’t exist. We are optimizing a process—”moving sticky notes”—that should be deleted entirely.
The “Infinite Canvas” Fallacy (Cognitive Load & Entropy)
If the sticky note is the atomic unit of the skeuomorphic lie, the “Infinite Canvas” is its containment field. The marketing pitch is seductive: “Space to think. No boundaries. Infinite possibilities.”
But let’s apply Socratic Inquiry (Category E - Implications and Consequences):
“If the canvas is truly infinite and unstructured, what is the logical consequence for data retrieval?”
The consequence is Maximum Entropy.
In Information Theory, entropy is a measure of disorder. An infinite canvas without an enforced schema is a high-entropy environment. In a database (like Airtable or a SQL server), a cell has a defined relationship to a column. You know what the data is (e.g., a “Status” or a “Date”) because of where it lives.
On an infinite canvas, a text box containing the word “Urgent” has no semantic meaning. It is just a vector object floating at coordinates (x: 4055, y: -230). It might be a label. It might be a status. It might be a piece of graffiti. The software doesn’t know. The user doesn’t know until they zoom in and decode the surrounding visual context.
This creates a phenomenon I call “Write-Only Memory.”
Collaborative teams spend hours dumping their mental state onto the canvas during a workshop. It feels productive because of the “IKEA Effect”—we value what we build. But once the session ends, the canvas dies. Why? Because the Cognitive Load required to re-enter that space, re-orient oneself on the X/Y axis, and re-decode the spatial relationships of hundreds of unlinked text boxes is too high.
Let us deconstruct the “User Complexity” involved here.
Navigation Cost: The user must pan and zoom to locate information. This is “scrolling for data,” a primitive method of retrieval compared to “querying for data.”
Context Switching: To understand a single note, the user must load the entire visual field.
Maintenance Load: Who cleans the board? Who aligns the boxes? Entropy increases over time. Without a “gardener,” the board becomes a digital landfill.
The “Infinite Canvas” violates the First Principle of Information & Control (Normalization). It refuses to normalize data. It prioritizes the freedom of input at the expense of the utility of output.
By allowing users to put anything anywhere, we ensure that nothing can be found by anyone. We are not “organizing thought”; we are essentially digital graffiti artists tagging an infinite wall, hoping someone walks by and understands the meaning.
The Facilitator Bottleneck (The Human Dependency)
We’ve established that the “Infinite Canvas” is a high-entropy chaos engine. How does the industry solve this? They don’t solve it with software; they solve it with Labor.
They introduce the “Certified Facilitator.”
Analyze this through the RFPA Protocol (Command 2: Delete the Part).
The Inquiry: “Why does this software require a specialized human operator to function effectively?”
If you look at the “success stories” of Miro or Mural, they almost always involve a “Power User” or an “Agile Coach” who spent hours before the meeting setting up the board (frames, templates, instructions) and hours during the meeting policing the participants (”Don’t touch that frame,” “Vote on this area,” “Follow me to view 3”).
This reveals a critical Process Failure. The tool is so unstructured and unintuitive that it requires a human interface layer to bridge the gap between the user’s intent and the software’s capability.
This is the “Wizard of Oz” anti-pattern. We think we are buying a SaaS product (Software as a Service), but we’re actually buying a tool that demands a Service Bureau model.
The Artifact: The “Workshop Template.”
The Cost: High-wage human capital spending hours on “administrative setup” (configuring the board) rather than “strategic thinking.”
Let’s calculate the Efficiency Gap:
Scenario: A strategic decision needs to be made by a team of 10.
Whiteboard Approach: 1 hour of prep by Facilitator. 1 hour of “icebreakers” and “warm-ups” (skeuomorphic social rituals). 1 hour of grouping stickies. 1 hour of Facilitator “synthesis” after the meeting to type the results into a Google Doc. Total Man-Hours: ~13 hours.
First Principles Approach: Asynchronous input of structured options. algorithmic clustering of sentiment. Automated vote tallying. Total Man-Hours: ~2 hours.
The Facilitator is a patch for bad software design. In the RFPA view, if you cannot Automate the facilitation, you have failed to Simplify the process enough. The goal should be a “Self-Driving Meeting,” not a “Chauffeur-Driven Whiteboard.”
The Data Silo: Why Whiteboards Are Where Data Goes to Hide
Finally, we arrive at the most damning technical flaw of the skeuomorphic whiteboard: Data Interoperability.
In the modern enterprise, data is the lifeblood. We’ve spent decades building “Systems of Record”—CRMs (Salesforce), ERPs (SAP), Issue Trackers (Jira), and Knowledge Bases (Notion/Confluence). These systems speak the language of Objects and APIs.
The Whiteboard speaks the language of SVG (Scalable Vector Graphics).
When a team makes a decision on a whiteboard, that decision is encoded as:
{ “type”: “rect”, “x”: 100, “y”: 200, “text”: “Launch Q3” }
To the rest of the enterprise stack, this is gibberish. It is not an object. It is not a task. It has no “Due Date” property that can trigger a calendar invite. It has no “Owner” field that can trigger a Slack notification. It is just a drawing.
This creates a Data Silo of the worst kind—a Semantic Dead End.
Input Problem: To get data onto the board, you have to manually type it or import static CSVs (which immediately go stale).
Output Problem: To get data off the board, you have to manually transcode it back into Jira or Confluence.
This violates Command 5: Automate. We can’t automate the flow of work if the “Work” is trapped in a format that machines can’t parse.
We’re entering the age of AI Agents. An AI Agent (like a Large Language Model) thrives on structured text and clear relationships. It struggles with “spatial reasoning” on an infinite canvas where proximity implies relationship but doesn’t guarantee it.
Query: “Hey AI, what was the decision regarding the Q3 launch?”
Database Response: “The status is ‘Approved’ on date 2024-10-12.”
Whiteboard Response: “I see a yellow box near a green circle, and a text box that says ‘Yes’. I am 40% confident this means approved.”
The Technical Complexity of extracting insight from a spatial canvas makes these tools fundamentally incompatible with the AI-driven future. They are “Pre-AI” artifacts, designed for human eyeballs, not machine intelligence.
We’ve deconstructed the Cloud Whiteboard and found it wanting. It’s a skeuomorphic lie that generates entropy, relies on human manual labor to function, and traps data in a semantic dead end. It’s not a tool for the future; it’s a digitized relic of the past.
Now, we must leave the realm of critique and enter the realm of physics. We must strip the system down to its First Principles to understand what collaboration actually is, and how to build a machine that respects the laws of information physics.
The First Principles (Physics & Axioms)
Chapter 5: Deconstructing the “Collaborative Session” (Matter & Energy)
To rebuild the concept of collaboration, we must first destroy the current definition of the “Session.” We must strip away the interface, the user experience, and the “fun” of dragging colored squares, and look exclusively at the physics of the system.
When we view a “brainstorming workshop” through the lens of the RFPA Protocol, specifically Command 2: Delete the Process, we ask: “What is the irreducible function being performed here?”
At the level of Information & Control, a collaborative session is a system designed to achieve a State Change.
Initial State (S0): High Uncertainty. Divergent mental models. Unresolved decision.
Target State (S1): Low Uncertainty. Convergent mental model. Resolved decision.
Mechanism: The exchange of Information (Bits) and the application of Compute (Human Cognition) to filter and rank that information.
The Physics of Waste:
In a First Principles analysis, any energy expended that does not directly contribute to the transition from S0 to S1 is Heat (Waste).
Let us audit the energy expenditure of a typical digital whiteboard session:
Rendering Energy: The GPU cycles required to render a zoomable, infinite vector canvas. (Waste: The decision does not require 60fps rendering).
Kinetic Energy (Virtual): The time and mouse-movement required to drag a sticky note from “Left” to “Right” to signify a status change. (Waste: State change is a metadata property, not a spatial coordinate).
Cognitive Energy: The brain cycles spent decoding the format (”Why is this box blue? Does blue mean ‘approved’ or ‘pending’?”) rather than processing the content. (Waste: Decoding un-normalized data).
The current paradigm of “Visual Collaboration” is essentially a High-Friction Interface for a low-bandwidth task. We are forcing users to manipulate a physics simulation (moving objects in 2D space) to achieve an informational result (changing a boolean value from False to True).
This is “Skeuomorphic Drag.” We are simulating the friction of the physical world—where you must move a paper note to organize it—in a digital world where sorting should be an instantaneous, zero-cost query. By requiring spatial manipulation, we are artificially slowing down the velocity of information to the speed of the human hand.
The “Idiot Index” of Digital Collaboration
The Idiot Index, a core component of the RFPA Protocol, is calculated by dividing the Current Commercial Cost of a product by the Theoretical Minimum Cost of its fundamental inputs.
Let us calculate the Idiot Index for a “Strategic Decision” reached via a Cloud Whiteboard.
The Theoretical Minimum (First Principles)
To make a decision, we need:
Input: 10 distinct ideas (Text strings, ~2kb total).
Processing: 5 humans reading these ideas (Reading speed: ~250 wpm -> ~2 minutes).
Compute: Each human ranks the ideas (Cognitive load: ~5 minutes).
Synthesis: An algorithm sorts the ranks (Time: ~10 milliseconds).
Total Time: ~7 minutes.
Total Cost: 7 minutes of salary x 5 people.
2. The Current Commercial Reality (The Whiteboard)
Setup: Facilitator prepares the board, finds “icebreaker” GIFs, creates “frames” (~60 mins).
Logistics: 5 humans log in, troubleshoot audio, navigate the canvas (~10 mins).
Execution: Humans spend 20 minutes creating stickies (typing + resizing + coloring).
The “Messy Middle”: Humans spend 30 minutes moving stickies around, grouping them visually, arguing over whether a sticky belongs in “Cluster A” or “Cluster B.”
Synthesis: Facilitator spends 30 minutes post-meeting transcribing the spatial clusters into a linear document.
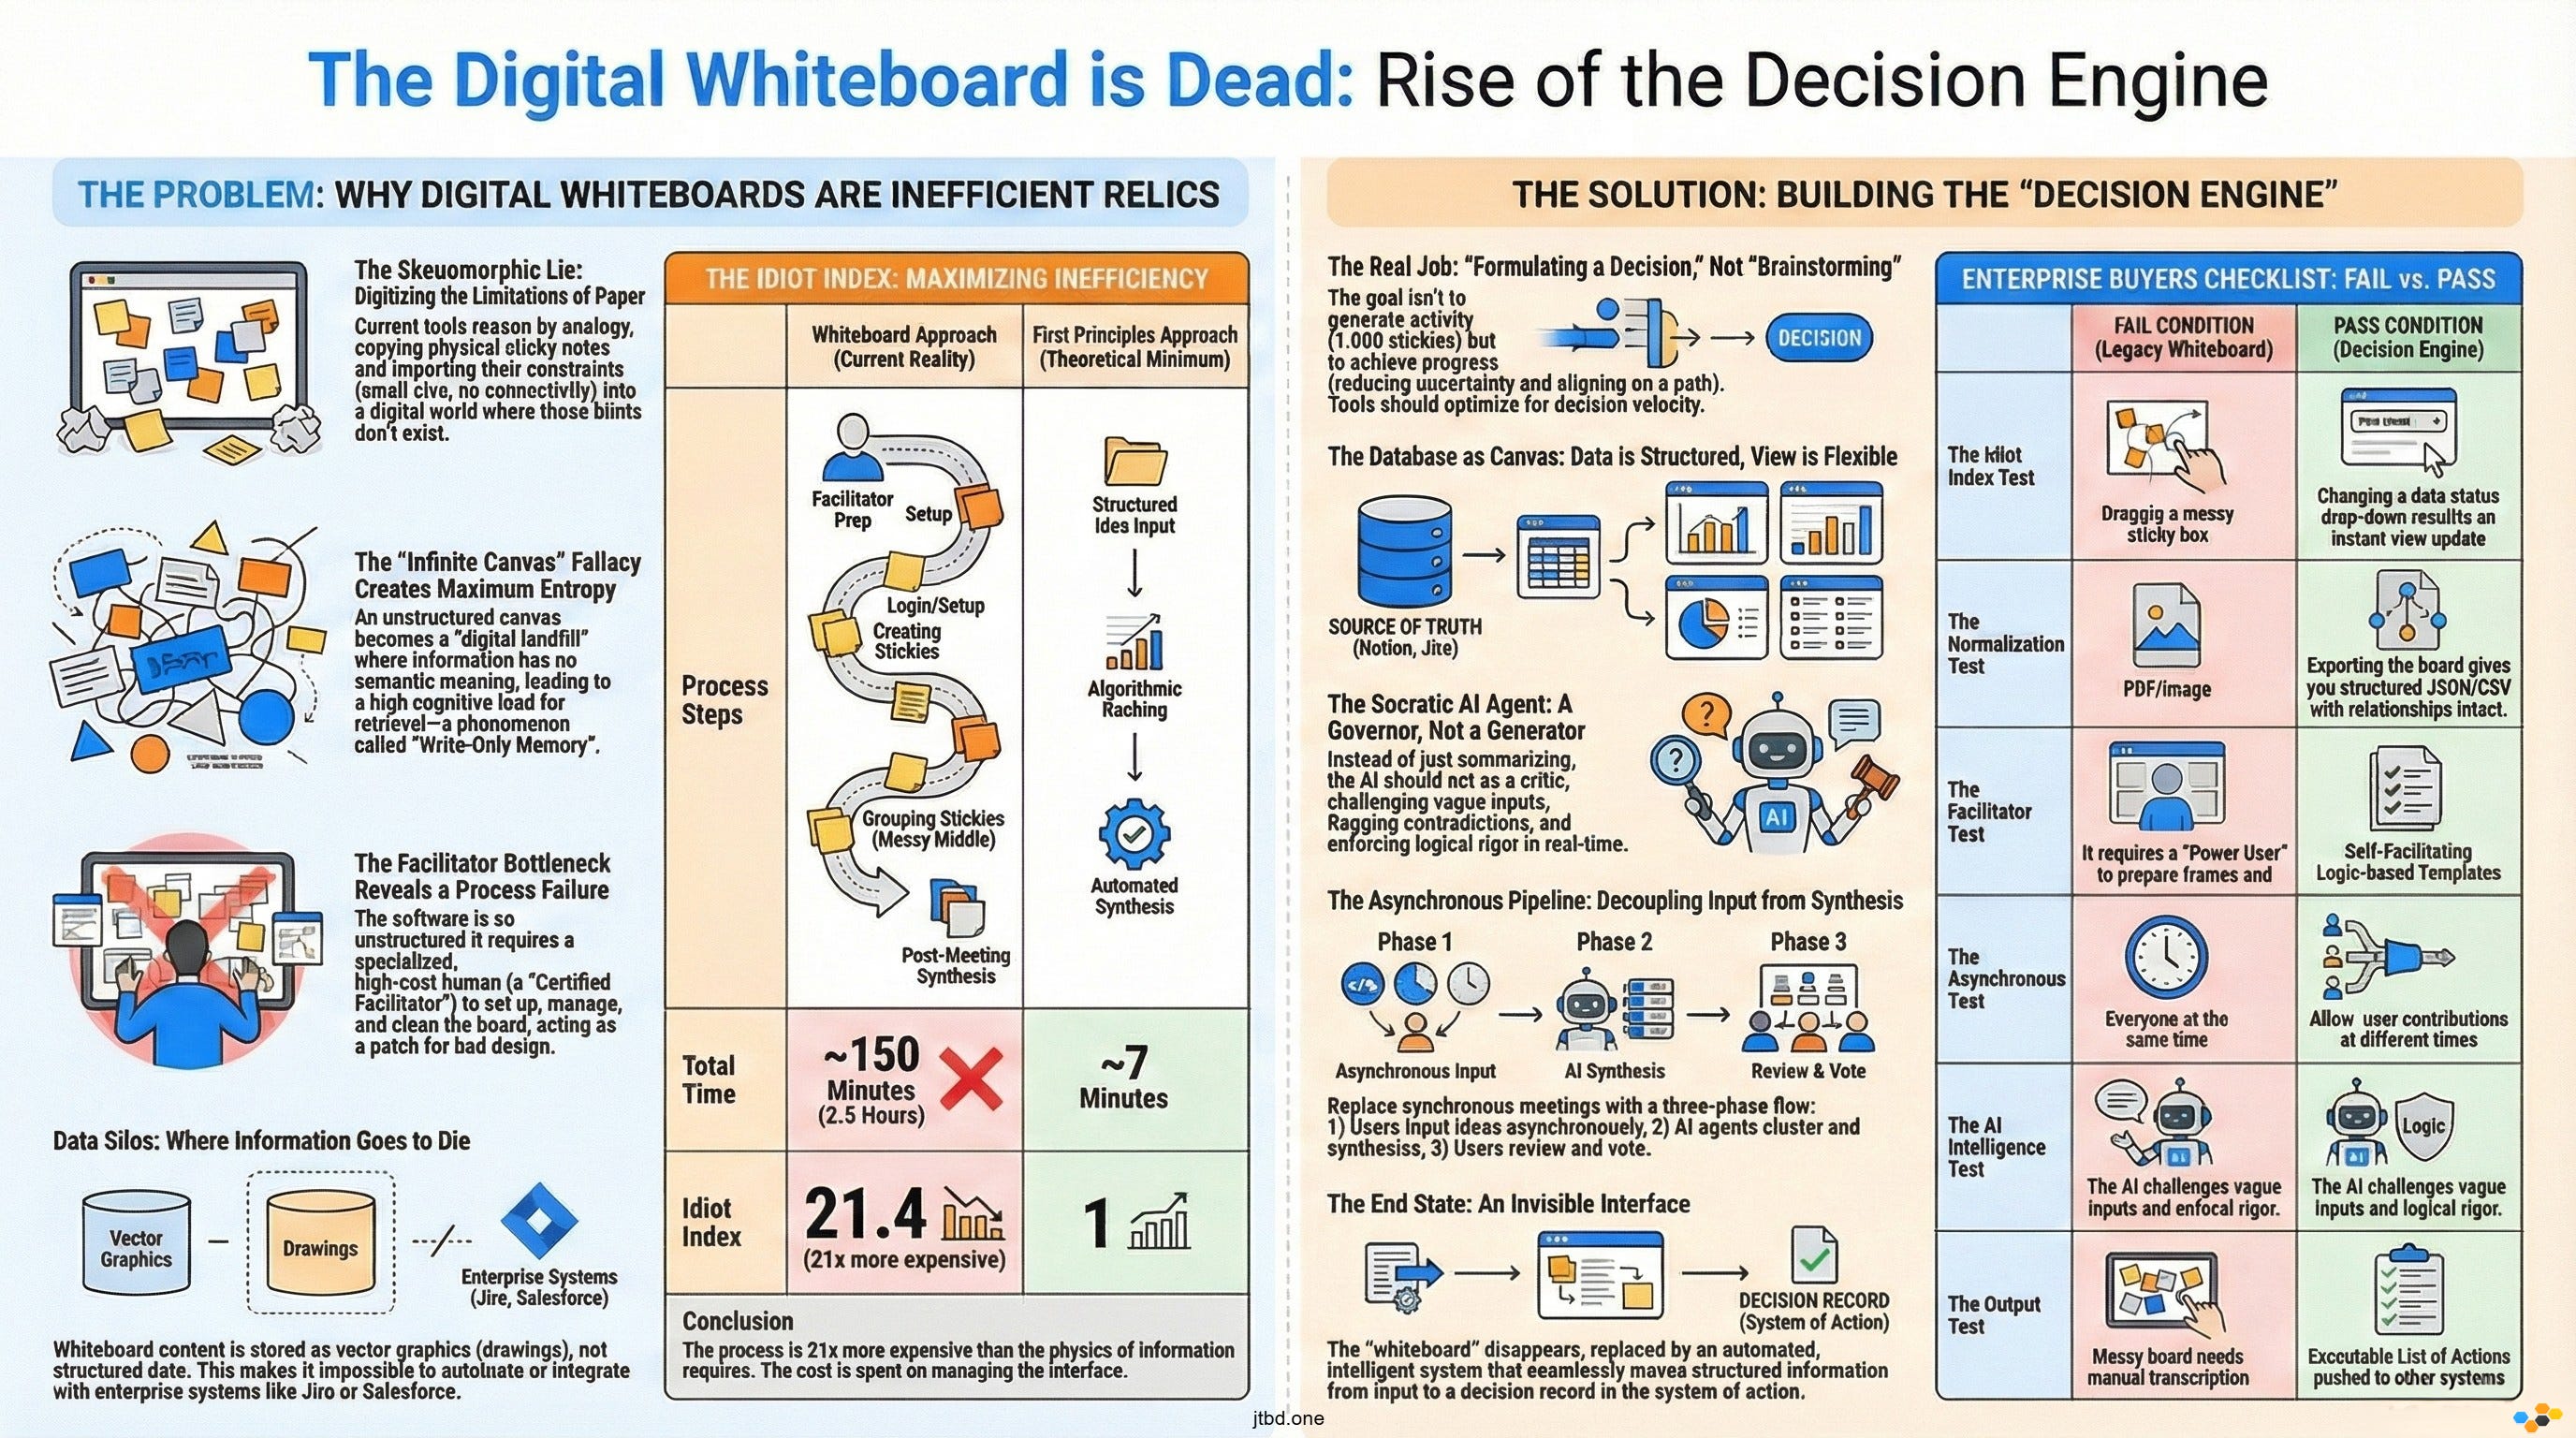
Total Time: ~150 minutes (2.5 hours).
Total Cost: 2.5 hours of salary x 5 people + Facilitator cost.
3. The Calculation
Idiot Index = 150 minutes / 7 minutes = 21.4
An Idiot Index of 21.4 means the current process is 21 times more expensive than the physics of information suggests it should be.
Where does the cost go? It goes into Interface Management.
In a spreadsheet or database, sorting 10 items is a click. On a whiteboard, sorting 10 items is a manual, drag-and-drop operation. We have taken a task that computers excel at (sorting and clustering) and handed it back to humans to do manually via a slow, visual interface.
This massive efficiency gap suggests that the market is ripe for disruptive innovation—specifically, a “disruption from below” where a new solution (likely AI-mediated structured data) eliminates the interface entirely.
The Ontology of Thought (Structuring the Unstructured)
The fundamental flaw of the whiteboard is not just efficiency; it is Ontology.
In computer science, Normalization is the process of structuring data to reduce redundancy and improve integrity. The “Infinite Canvas” is the enemy of normalization.
The Axiom: “All enduring collaboration is structured data creation.”
When a team writes on a whiteboard, they are creating data. But because the container (the canvas) is unstructured, the data becomes “blob storage.”
The Bitmap Approach (Miro/Mural): An idea is a visual object. It has properties like
color,x-position,width. It lacks properties likestatus,owner,dependency.The Object Approach (Notion/Linear/Airtable): An idea is a database row. It has properties like
status,owner,related_to.
The Technical Complexity of Retrieval:
Because the whiteboard lacks an object model, it cannot be queried. You cannot ask a whiteboard, “Show me all ideas created by Sarah that are High Priority.” You can only look at the board and visually scan for yellow squares (assuming Sarah used yellow for high priority).
This is a violation of the Information & Control system. Specifically, it fails at (D2) Normalization & Ontology.
Problem: The system allows the user to define the ontology ad-hoc (e.g., “Let’s make red stickies mean ‘Risk’”).
Result: This ad-hoc ontology is not machine-readable. It is “tribal knowledge” that evaporates when the meeting ends.
The Future: The Graph, Not the Canvas
Smart companies will move away from the “Canvas” metaphor and toward the “Graph” metaphor. An idea is a node. A decision is a node. A person is a node. The “whiteboard” is just a temporary view of the underlying graph, not the storage medium itself.
If we treat thought as an object, we can apply Automation. We can have agents crawl the graph and say, “This idea contradicts that decision.” We cannot do that if the idea is just a pixelated square on a WebGL plane.
The Speed of Light Limit (Latency in Human-to-Human Consensus)
We conclude our First Principles analysis by examining Time.
The “Whiteboard Workshop” is built on the assumption of Synchronous Collaboration. Everyone must be present, at the same time, looking at the same screen.
This violates the Cycle Time imperative of the RFPA Protocol.
The Latency Problem:
Human cognitive processing speeds vary.
Fast Thinkers: Read and synthesize quickly. They get bored waiting for others to catch up.
Reflective Thinkers: Need time to process. They get overrun by the “loudest voice in the room” (or the fastest typist).
By forcing synchronization, we are engaging in “Batch Processing” of human intelligence. We wait for 10 people to align, lock them in a room (virtual or physical), and run the process at the speed of the slowest component (the slowest reader or the worst internet connection).
The “Grave Digging” Warning:
The industry response has been to make the tools “faster” (real-time cursors, reaction emojis). This is “Digging the Grave Faster.” The problem isn’t that the cursors aren’t fast enough; the problem is that synchronous brainstorming is inherently flawed.
The Theoretical Minimum (Asynchronous Pipeline):
Phase 1 (Diverge): Humans input ideas asynchronously. No meetings. No “waiting for the canvas to load.” Just pure data entry into a structured form.
Phase 2 (Synthesize): AI agents cluster and summarize the inputs.
Phase 3 (Converge): Humans review the synthesized output and vote.
This is a Pipeline Architecture. It decouples the input from the processing. It respects the Speed of Light Limit of information. It allows “Idea A” to be processed while “Idea B” is still being written.
Current whiteboards are “Monolithic Applications” for thought—tightly coupled, synchronous, and brittle. The future is “Microservices for Thought”—loose coupling, high cohesion, and asynchronous execution.
We have stripped the “Digital Canvas” down to its atoms. We found that it is energetically wasteful (High Idiot Index), structurally unsound (Un-normalized Data), and temporally inefficient (Synchronous Latency). It is a tool fighting against the physics of information.
Now, we must rebuild. We must use Jobs-to-be-Done (JTBD) to define what the user is actually trying to do, and construct a solution that aligns with these First Principles.
The Reconstruction (JTBD & Strategy)
The Job is Not “To Brainstorm” (Defining the Core Job)
Having deconstructed the digital whiteboard into a pile of inefficient atoms and un-normalized data, we must now rebuild the solution from the ground up. To do this, we turn to Jobs-to-be-Done (JTBD) theory.
The first mistake of the whiteboard industry was a failure of definition. They looked at the activity customers were performing (”brainstorming”) and assumed that was the job.
This is the “Drill vs. Hole” fallacy. “Brainstorming” is the drill. It is a method, a solution, a ritual. Nobody wakes up in the morning and says, “I want to brainstorm today.” They brainstorm because they are struggling to make progress on a deeper functional goal.
If we apply the JTBD Verb Lexicon, we can strip away the “Experiential Job” (Feeling creative, feeling heard) and isolate the “Core Functional Job.”
The Core Job is: “Formulating a strategic decision based on disparate inputs.”
Let us analyze the difference between the “Activity” and the “Progress”:
Activity (The Whiteboard Focus): Generating ideas, placing stickies, voting on colors, moving shapes.
Progress (The Customer’s Goal): Reducing uncertainty, eliminating invalid options, aligning the group on a single path.
Current tools optimize for Volume of Activity. They celebrate “1,000 stickies generated!” This is a vanity metric. If you generate 1,000 ideas but fail to converge on a decision, the job has failed.
The Hiring and Firing Criteria:
When a customer “hires” Miro or Mural, they are essentially hiring a “Digital Conference Room.” But they are about to “fire” this solution because it fails the Optimization rule of the RFPA Protocol.
Why they fire it: It requires too much manual labor (The Facilitator) to extract value. The “Time-to-Data” is too long.
What they will hire next: A system that “Formulates the decision” for them. They will hire a “Decision Engine,” not a “Drawing Tool.”
The future winner in this space will not be the tool with the best “sticky note physics.” It will be the tool that Minimizes the time it takes to converge on a valid decision.
The “Decision Synchronization” Job Map
To see exactly where the current tools fail, we must construct a Job Map. A Job Map is not a user journey; it is a chronological representation of the functional steps required to get the job done, regardless of the solution.
The job is “Formulating a strategic decision.”
The Universal Job Map Analysis:
1. Define (The Black Hole):
Step: Determine the criteria for the decision (e.g., budget, timeline, risk tolerance).
Current Failure: Whiteboards have no “schema” for criteria. Criteria are usually just verbal instructions or a text box that gets lost.
First Principle Opportunity: Enforce “Constraint Definition” before the board even opens.
2. Locate (The Friction Point):
Step: Gather the necessary inputs (data, previous decisions, market research).
Current Failure: Users must screenshot data from dashboards and paste it as static images. This disconnects the data from its source (The Data Silo).
First Principle Opportunity: Live data pipes. The “Locate” step should be an API call, not a screenshot.
3. Prepare (The Labor Sink):
Step: Organize the environment for the synthesis.
Current Failure: The Facilitator spends hours creating “frames” and “lanes.”
First Principle Opportunity: Auto-generated templates based on the “Define” step.
4. Confirm (The Check):
Step: Verify all stakeholders are present and have access.
Current Failure: “Can everyone see my screen?” “I can’t find the link.”
5. Execute (The Chaos):
Step: Generate and capture potential options.
Current Status: This is the only step whiteboards currently address. They excel at “capturing,” but often fail at “structuring.”
6. Monitor (The Void):
Step: Assess if the session is converging or diverging.
Current Failure: The Facilitator relies on “vibes.” There is no real-time metric for “Consensus Score.”
7. Modify (The Manual Adjustment):
Step: Change the approach if consensus is not reached.
Current Failure: “Let’s delete these stickies and start over.” High cost of rework.
8. Resolve (The Conflict):
Step: Select the final option and resolve dependencies.
Current Failure: “Voting dots.” A crude mechanism that lacks nuance (Why did you vote no?).
9. Conclude (The Disconnection):
Step: Finalize the decision and trigger downstream actions.
Current Failure: The Facilitator manually types the decision into Jira or Slack. The “Whiteboard” is a dead end.
Analysis:
Current tools serve only Step 5 (Execute) and part of Step 3 (Prepare). They ignore the “Bookends” of the job. Value is leaking at the Define stage (garbage in) and the Conclude stage (no executable output). The “Next Generation” tool will envelop the entire map.
The Disruption Option: The Higher-Level Job
In the Real Options Approach to Innovation, we ask the “Disruption Option” question to elevate the level of abstraction.
The Question: “Is there a higher-level job we could be doing that would make this entire job obsolete?”
Current Job: “Facilitating a collaborative meeting to reach a decision.”
The Trap: Building better features for facilitators (timers, voting, music). This is “Sustaining Innovation.”
The Disruption Option: “Automating the synthesis of team intelligence.”
If we elevate the job to “Synthesizing Intelligence,” we realize that the meeting itself is often a waste mechanism. The meeting is a synchronous patch for the inability to synthesize asynchronous data.
The Paradigm Shift:
Instead of a tool that helps 10 people talk for an hour, we build a tool that collects 10 asynchronous inputs and presents the mathematically optimal consensus for approval.
Old Way: 10 people x 60 minutes = 600 man-minutes.
New Way: 10 people x 5 minutes (input) + AI Synthesis (1 minute) + 10 people x 5 minutes (review) = 101 man-minutes.
This Higher-Level Job creates a Structure Innovation. It changes the organization of talent. It moves from “Collaborative Creation” to “Collaborative Review.” The AI becomes the “Creator/Synthesizer,” and the humans become the “Editors/Approvers.”
This is the First Principle of Automation: “Automate the simplified, necessary residue.” We have simplified the meeting down to “Input” and “Approval,” and automated the “Synthesis.”
Desired Outcomes: Quantifying the Shift
To build this future, we need strict metrics. We must move from “Vanity Metrics” (Active Users, Stickies Created) to Customer Success Statements (CSS) that measure efficiency and reliability.
Using the ODI Format (Minimize... + Metric + Object of Control), we can define the success criteria for the “Post-Whiteboard” era.
The Efficiency Metrics (Time):
“Minimize the time it takes to structure raw inputs into distinct thematic clusters.” [Theme: Automated Synthesis]
“Minimize the time it takes to import relevant context from external systems of record (e.g., Jira, Salesforce).” [Theme: Data Interoperability]
“Minimize the time it takes to identify conflicting viewpoints within the group.” [Theme: Conflict Detection]
The Stability Metrics (Likelihood/Risk):
“Minimize the likelihood of misinterpreting a sticky note due to lack of context.” [Theme: Ontology/Normalization]
“Minimize the likelihood that decision criteria are ignored during the brainstorming phase.” [Theme: Constraint Management]
“Minimize the likelihood of data loss when transferring the final decision to the execution system.” [Theme: Integration]
The Financial Metric:
“Minimize the cost of labor associated with meeting facilitation and setup.”
Socratic Check (Implications):
If a tool achieves CSS #1 (Automated Clustering) and CSS #7 (Minimize Labor), the role of the “Certified Facilitator” is deprecated. The software becomes the facilitator.
If a tool achieves CSS #2 (Import Context) and CSS #6 (Data Transfer), the “Canvas” ceases to be a silo and becomes a “View” on the enterprise database.
The Verdict:
The current market leaders (Miro, Mural) score poorly on these metrics. They maximize the time to structure (manual drag-and-drop). They maximize the likelihood of misinterpretation (unstructured text). They are vulnerable. A competitor that attacks these specific Outcome Statements will win the market by offering a superior Job Solution.
We have redefined the job. It is not about “Space to Think”; it is about “Speed to Decide.” We have mapped the broken process and identified the disruption point: replacing the “Meeting” with the “Synthesis Engine.”
Now, in the final Part IV, we will predict how this execution plays out. We will look at the Real Options for investors and builders, and describe the “End State” where the whiteboard disappears entirely.
The Execution (Evolution & Real Options)
The Convergence: The Database as Canvas
The “Whiteboard” as a standalone software category is a dead man walking. It is a “feature” masquerading as a “product,” and in the history of software, features eventually get swallowed by the underlying Operating System.
To understand who will swallow the whiteboard, we must look at Doblin’s 10 Types of Innovation, specifically within the Configuration category. The innovation battle here is not about “Product Performance” (who has the smoother pen tool); it is about “Structure” and “Process.”
The Structural Shift: From “Drawing” to “Viewing”
The future belongs to the “Database as Canvas” model. In this paradigm, the canvas is not a storage medium; it is merely a temporary view of a structured database.
The Current Model (Miro/Mural): You create a sticky note. It lives on the board. If you delete the board, the data dies.
The Converged Model (Notion/Airtable/Atlassian): You create a database row (an “Issue,” a “Task,” a “Lead”). You can view it as a list, a Kanban board, a timeline, or—critically—a Spatial Canvas.
When the database becomes the canvas, the Idiot Index drops precipitously. There is no “double entry” of data. There is no “transcribing the sticky notes.” The sticky note is the Jira ticket. The arrow connecting them is the “Blocking” dependency in the database.
The Prediction:
Standalone whiteboard companies are currently scrambling to build databases (adding “tags” and “tables” to their vector engines). But they are fighting gravity. It is infinitely harder to turn a vector drawing engine into a relational database than it is to turn a relational database into a spatial view.
Companies like Atlassian (Jira/Confluence) or Microsoft (Loop) or Notion have the Asset Advantage. They own the “Source of Truth.” They will simply enable “Canvas View” on their existing data objects, rendering the standalone whiteboard redundant. The “Whiteboard” becomes just another lens on the enterprise knowledge graph.
The Socratic AI Agent (Automating the Facilitator)
If the “Database” solves the data structure problem, AI Agents will solve the “Facilitator Bottleneck.”
We must apply Command 5: Automate from the RFPA Protocol. But we must be careful not to build the “Alien Dreadnought”—automating a broken process. We are not automating “moving stickies.” We are automating “Governance and Synthesis.”
Current “AI features” in whiteboards are weak. They offer “Summarize this cluster” or “Generate more ideas.” This is Generation, not Deconstruction. It adds to the noise (Entropy) rather than reducing it.
The future is the Socratic AI Tutor.
Imagine a whiteboard session where an AI agent monitors the input in real-time. It does not just “summarize”; it actively intervenes using the Socratic Scalpel.
Scenario:
Human User: Types a sticky: “We need to optimize the onboarding flow.”
Socratic Agent: Detecting a vague requirement, the Agent highlights the note and prompts: “Clarification required: By ‘optimize,’ do you mean reduce time-to-value or increase conversion rate? And what evidence suggests this is the bottleneck?”.
This transforms the board from a passive surface into an Active Governor. The AI acts as the “Critic” in a Multi-Agent Socratic Dialogue.
It enforces MECE (Mutually Exclusive, Collectively Exhaustive) principles on brainstorming groups.
It flags “Leaps of Faith” (Level 3 Assumptions) that lack evidence.
It identifies contradictions between a new idea and a previously agreed-upon constraint.
This automation deletes the “Process Step” of the human facilitator having to police the quality of ideas. The software enforces the rigor of First Principles thinking automatically.
The “Self-Facilitating” Board (Product System Innovation)
We move now to Product System Innovation—how distinct products and services connect to create a robust system.
The “Next Gen” whiteboard is not an island; it is a Hub. It automates the Locate and Conclude phases of the Job Map.
The “Locate” Phase Automation:
Instead of a blank white screen (which induces “Blank Page Syndrome”), the board pre-populates based on context.
Trigger: “Quarterly Planning Session.”
System Action: The board pulls the Q3 performance data from Salesforce, the uncompleted features from Jira, and the budget constraints from the ERP. It arranges them into a “Context Zone” automatically.
Value: Zero setup time. The “Physics” of the meeting are already laid out.
The “Conclude” Phase Automation:
When a decision is marked as “Final” on the board, the system triggers the Resolving Actions.
System Action: It updates the Jira status to “Approved.” It posts a summary to the Slack channel. It archives the rejected options in the “Decision Log” database for future reference (Provenance).
This is the “Self-Facilitating” Board. It handles its own administrative overhead. It respects the RFPA rule: “Automate the remaining efficient process”. By removing the manual friction of “Setting Up” and “Tearing Down” the meeting, we reduce the Cycle Time of decision-making to the theoretical minimum.
The Invisible Interface (Conclusion)
We began this deconstruction by exposing the “Skeuomorphic Lie” of the digital sticky note. We end it by predicting the disappearance of the interface entirely.
The “Whiteboard” is a transition technology. It bridged the gap between the physical office and the digital future. But like the “Save Icon” (a floppy disk) or the “Phone App” (a handset), the visual metaphor of the “Board” will fade as the underlying technology matures.
The End State is an Invisible Interface for decision intelligence.
Input: Structured, asynchronous, multi-modal (voice, text, data).
Processing: AI-mediated synthesis, Socratic challenging of assumptions, conflict detection.
Output: A decision record, pushed to the System of Action.
The companies that win this space will not be the ones that build the “prettiest” infinite canvas. They will be the ones that understand the Physics of Information. They will recognize that “collaboration” is just a fancy word for “Data Normalization” and “Error Correction” among distributed nodes (humans).
The Final “Idiot Index” Check:
Today: We spend billions of dollars on software that lets us drag colored squares around a screen to simulate a wall. (Index: ~20).
Tomorrow: We will spend money on software that helps us think, structure, and decide without the drag of skeuomorphic baggage. (Index: ~1).
The Digital Canvas is dead. Long live the Decision Engine.
Appendix
The First Principles Glossary
A lexicon for the Robust First Principles Analyst (RFPA). These terms define the physics of the transition from “Digital Whiteboards” to “Decision Engines.”
Alien Dreadnought
The mistake of automating a complex process that should have been deleted. In the context of collaboration, this refers to building AI agents to “read” sticky notes on a canvas, rather than simply using a structured database where the “reading” is instant and error-free.
Disruption Option
A strategic pivot achieved by asking, “Is there a higher-level job we could be doing that would make this entire job obsolete?” Instead of building a better whiteboard (sustaining), the Disruption Option is to build an automated synthesis engine that makes the meeting itself unnecessary.
Idiot Index
A calculation of efficiency derived by dividing the current commercial cost of a product/process by the theoretical minimum cost of its fundamental inputs.
Formula:
Current Price / Theoretical Minimum (Atoms/Energy/Bits)Application: If a decision takes 2.5 hours via whiteboard but only 7 minutes via structured query, the Idiot Index is ~21.4, indicating massive inefficiency.
Job-to-be-Done (JTBD)
A framework that posits customers do not buy products; they “hire” them to make progress on a stable, functional goal. The core job of a whiteboard is not “to brainstorm” (activity) but “to formulate a strategic decision” (progress).
Normalization (Data)
The process of organizing data to reduce redundancy and improve integrity. Whiteboards fail at normalization because they treat data as “vector graphics” (unstructured pixels) rather than “objects” (structured rows), leading to high-entropy “write-only” environments.
Reasoning by Analogy
The cognitive trap of building solutions based on what already exists (e.g., “It’s like a sticky note, but digital”). This imports the limitations of the physical world (size, lack of connectivity) into the digital realm.
Skeuomorphic Drag
The efficiency loss caused by retaining ornamental design cues from physical tools. In whiteboards, this is the time and energy wasted dragging, resizing, and coloring digital objects to mimic the friction of paper management.
Socratic Scalpel
An intellectual tool used to systematically challenge assumptions and uncover core truths. In this context, it is used to question the “Stuck Belief” that collaboration requires a visual canvas.
Socratic AI Agent
An AI entity designed not just to answer questions, but to ask them. It acts as a “tutor” or “governor” within a system, challenging user assumptions and enforcing rigor in real-time.
The Enterprise Buyer’s Checklist (First Principles Edition)
Objective: Use this checklist to evaluate any collaboration tool. If a tool fails these RFPA and JTBD checks, it is a legacy artifact, not a future-proof solution.
Phase 1: The Physics Check (Efficiency & Structure)
The Idiot Index Test: Does the tool require manual manipulation of visual elements (drag-and-drop) to sort or cluster ideas?
Fail: Yes, I have to drag boxes around. (High Idiot Index).
Pass: No, I can change a “property” (e.g., Status) and the view updates instantly. (Low Idiot Index).
The Normalization Test: Is the data stored as “Objects” or “Graphics”?
Fail: If I export the board, I get a PDF or an image.
Pass: If I export the board, I get a structured JSON/CSV with semantic relationships intact.
The Interoperability Test: Can I “Locate” data via API?
Fail: I have to take screenshots of my dashboard and paste them onto the canvas.
Pass: The board pulls live data rows directly from my System of Record (Jira/Salesforce).
Phase 2: The Process Check (Automation vs. Labor)
The Facilitator Dependency: Does the tool require a “Power User” to set up and manage the session?
Fail: We need a certified facilitator to build the frames and manage the timer. (Process Failure).
Pass: The tool “Self-Facilitates” using templates and logic to guide the team from input to decision.
The Asynchronous Capability: Can the tool function without a meeting?
Fail: It only works if we are all looking at the screen at the same time (Synchronous Latency).
Pass: It creates a “Pipeline” where users contribute asynchronously, and the system synthesizes the results.
Phase 3: The Intelligence Check (Socratic Governance)
The “Yes Man” Test: Does the AI just summarize what we wrote?
Fail: The AI summarizes bad ideas without question.
Pass: The AI challenges vague inputs (e.g., “Clarify what you mean by ‘optimize’”) and enforces logic.
The Searchability Test: Can I query the decision history?
Fail: I have to visually scan old boards to find what we decided last quarter. (Entropy).
Pass: I can search “Decision: Q3 Budget” and retrieve the exact record and its rationale immediately.
Phase 4: The Outcome Check (JTBD)
The Core Job Alignment: Does the vendor sell “Brainstorming” or “Deciding”?
Fail: They tout “Infinite Canvas” and “Creativity” (Activity-focused).
Pass: They tout “Decision Velocity” and “Alignment” (Progress-focused).
The Output Viability: What is the artifact at the end of the session?
Fail: A messy visual board that must be transcribed.
Pass: An executable list of actions pushed to the project management system.
I make content like this for a reason. It’s not just to predict the future; it’s to show you how to think about it from first principles. The concepts in this blueprint are hypotheses—powerful starting points. But in the real world, I work with my clients to de-risk this process, turning big ideas into capital-efficient investment decisions, every single time.
Follow me on 𝕏: https://x.com/mikeboysen
If you’re interested in inventing the future as opposed to fiddling around the edges, feel free to contact me. My availability is limited.
Mike Boysen - www.pjtbd.com
De-Risk Your Next Big Idea
Masterclass: Heavily Discounted $67
My Blog: https://jtbd.one
Book an appointment: https://pjtbd.com/book-mike
Join our community: https://pjtbd.com/join
