


Every year, global enterprises deploy hundreds of billions of dollars into managing their customer relationships. We build elaborate voice-of-the-customer programs, mandate front-line empathy training, purchase premium customer relationship management (CRM) platforms, and monitor real-time sentiment dashboards. Yet, despite this historic capital allocation, actual customer service quality routinely feels like it is hovering at an all-time low.
The root cause of this stagnation is not a lack of effort, culture, or budget. It is a foundational instrumentation crisis. Modern customer experience (CX) architecture is built on a massive confidence trick: it measures the weather—how a customer felt about a specific transaction—instead of the climate—whether the customer actually accomplished the goal they showed up to achieve.
When the metrics we track reward themselves while customers quietly walk out the back door, we are no longer practicing business strategy; we are operating high-stakes corporate theater. By stripping this $40-billion-dollar measurement industry down to its irreducible first principles, we can expose the structural illusion costing enterprises millions and map out a bulletproof architectural pivot to behaviorally verified goal attainment.
The Category Error of Touchpoint Satisfaction (Sentiment vs. Attainment)
The modern CX apparatus operates under a massive, unexamined delusion: the assumption that a customer who states they are satisfied is a customer who successfully completed their objective. This is a fundamental category error. Sentiment and attainment are entirely independent variables. A customer can struggle intensely through a fragmented workflow yet ultimately succeed, just as easily as they can glide effortlessly through a beautiful interface and completely fail to achieve their functional goal.
To understand why this illusion persists, we must look at the structural incentives of the corporate supply and demand loops:
Survey Vendors: Companies like Qualtrics and Medallia build business models entirely around the collection and throughput of attitudinal data. They have no commercial motive to verify outcomes behaviorally because their core product is the survey itself.
Consulting Firms: The primary deliverable of major advisory practices is the diagnosing of sentiment gaps and the prescription of organizational restructures, typically packaged as PowerPoint decks rather than verified economic outcomes.
Customer Success Platforms: Account health scores are routinely calculated using lightweight, cheap inputs like login volume, rather than cross-functional data pipelines that trace true goal execution.
Internal Executive Incentives: Chief Customer Officers and Chief Marketing Officers are frequently compensated based on the upward movement of Net Promoter Scores (NPS) or Customer Satisfaction (CSAT) trends. Front-line agents learn to time their requests, coach friendly users, and manipulate delivery mechanics to artificially protect these scores.
The stable equilibrium of the current system is driven by the fact that attitudinal data is cheap to collect, easy to gamify, and exceptionally comfortable to display in executive boardrooms. Meanwhile, the customers who suffer most from these blind spots—the ones who experience outcome failure—simply stop using the product without ever filling out an exit survey.
“Ninety percent of executives believe they deliver a superior customer experience, while only forty percent of their customers agree. The perception gap isn’t a customer perception problem — it’s an instrumentation problem. The executives are reading the dashboard. The customers are living the outcome.”
By reorienting the primary unit of analysis from the interaction to the job-to-be-done, we transform customer experience from an amorphous marketing cost center into a hard, auditable growth discipline.
The 803x Cost Confession: Exposing the $2,007 Manual Reconstruction Tax
When an enterprise tries to verify whether an enterprise account actually achieved its board-stated business case, it quickly runs into a crushing operational tax. Because data is trapped in deeply entrenched corporate silos, verifying an outcome today requires manual human reconstruction. Analysts must stitch data across CRMs, product logs, billing records, and support ticket histories.
The unit economics of this manual process are devastating:
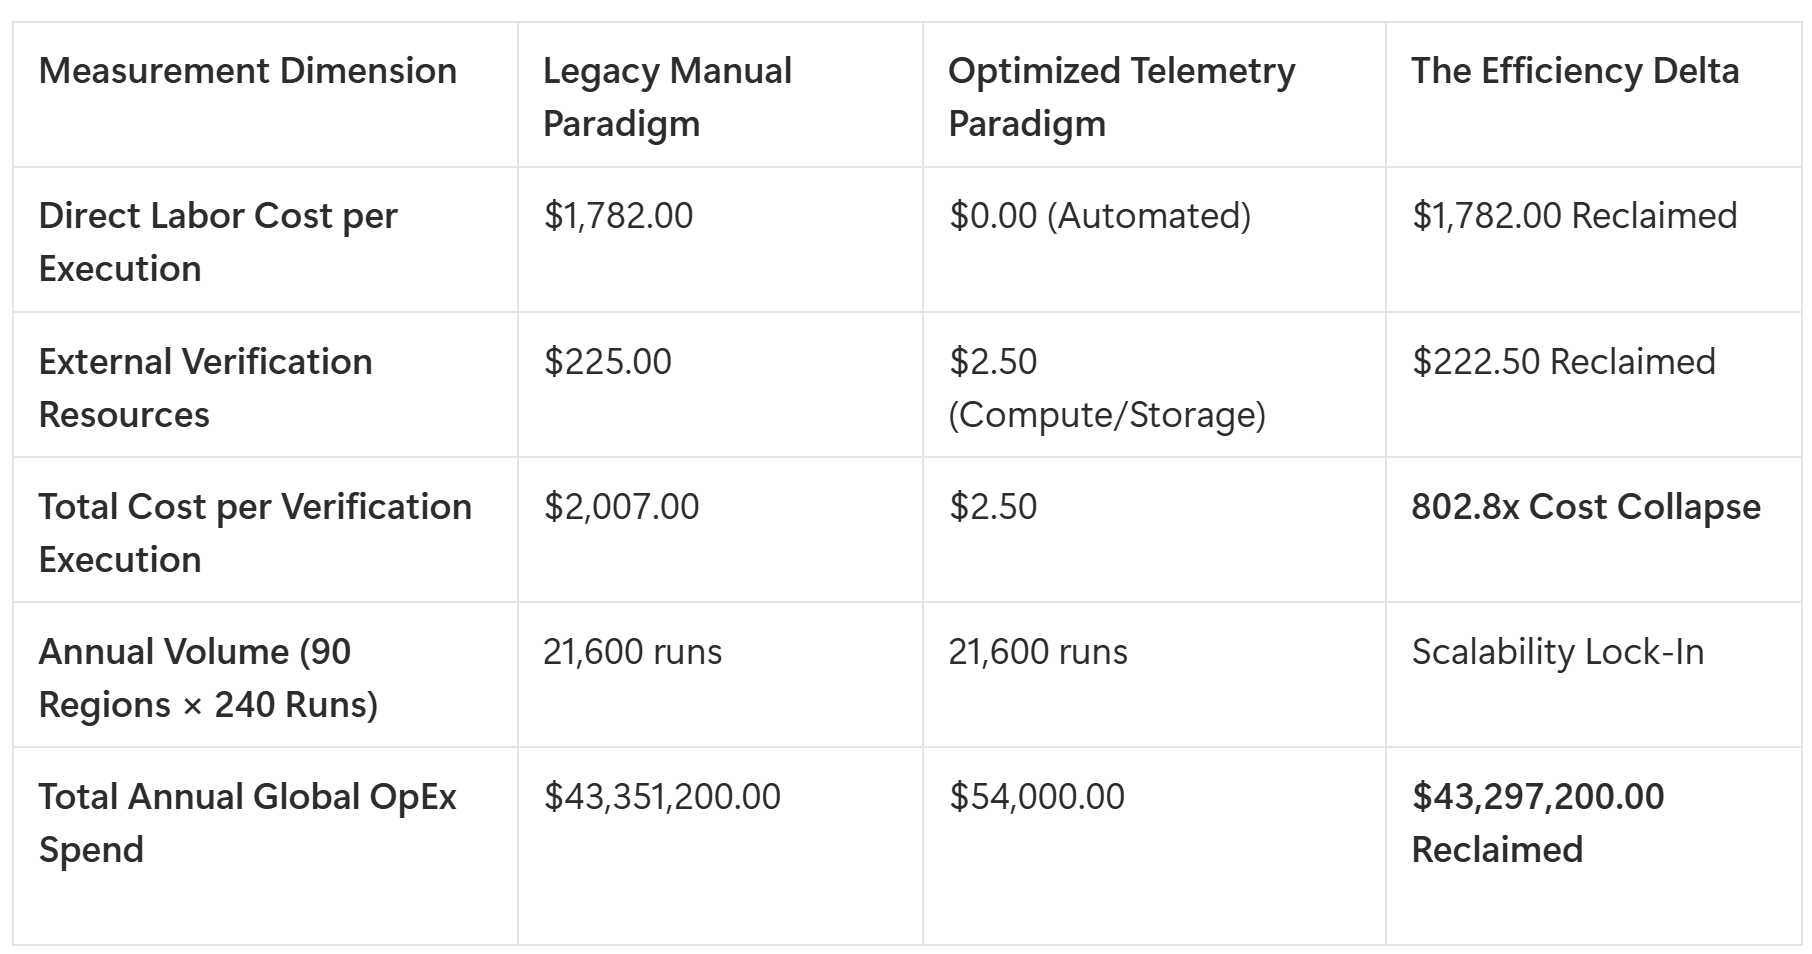
An 803x cost multiplier is not an incremental productivity win; it is a category confession. Paying $2,007 to manually piece together a timeline of events means you are paying an exorbitant tax to reconstruct a truth that your back-office and telemetry systems already recorded in real time.
The $2,007 fee buys human effort, coordination meetings, and spreadsheet stitching. The $2.50 physics floor buys pure truth, delivered automatically by a federated event substrate. Reclaiming the $43.3 million in annual global operational waste is simply the baseline incentive for structural reform.
Silent Disengagement Is Your Loudest Core Failure Signal
The most dangerous customer in any corporate portfolio is the one who goes completely quiet. In the legacy survey paradigm, a customer who does not respond to an NPS survey is effectively treated as a non-event or a neutral data point. This is an incredibly costly misinterpretation. Research demonstrates that a massive 52% of consumers abandon brands entirely after a single bad experience, and 29% walk away after one poor service interaction.
The vast majority of these departing customers do not voice their frustration through support channels or post-call surveys; they exhibit silent disengagement. They stop logging into the application, abandon core features, let their usage decay, or experience unresolved billing anomalies.
[Customer Experience Failure]
               │
               ▼
┌──────────────────────────────┐
│  Will They Complete Survey?  │
└──────────────┬───────────────┘
               │
       ┌───────┴───────┐
       ▼               ▼
   [Yes: 12%]      [No: 88%]
       │               │
       ▼               ▼
 [Voiced Echo]   [Silent Decay]
 (NPS Theater)   (Invisible Loss)
                       │
                       ▼
             [$325.1M Stranded CLV]
Consider the true scope of this invisible drain across a global enterprise enterprise:
The Local Reality: A single mid-market B2B account experiencing a single undetected outcome failure can easily result in $400,000+ in lifetime value silently evaporating down the drain.
The Detection Lag Tax: When an organization relies on surveys, the typical lag between initial feature abandonment and active human intervention spans quarters, rendering the eventual renewal conversation purely defensive.
The Global Aggregate: When you scale this 30% friction-induced pipeline abandonment rate across ninety global operating regions, the enterprise strands an astronomical $325,134,000.00 in annual relationship value.
A complaining customer is still actively engaged in the relationship; they are signaling a desire for the process to be repaired. The silent customer has checked out behaviorally. By treating absence-of-telemetry as a definitive negative behavioral signal rather than a neutral omission, companies can reverse the silent-decay cascade before the account moves to a competitor.
The Jevons Rebound Trap (E = 1.06): Why Optimizing the Status Quo Backfires
When executives realize they are burning millions on manual verification, their instinctive reaction is to pursue internal workflow automation. They buy AI copilots to help analysts summarize text, or deploy workflow tools to speed up manual data collection. This approach is an optimization trap.
In economics, the Jevons Paradox dictates that increasing the efficiency of a resource resource lower its effective cost, which drastically expands its consumption. The behavioral verification space features a Jevons Elasticity Factor of E = 1.06. Because this factor sits above the 1.0 unit-elastic threshold, any strategy focused on incremental optimization will trigger a volume rebound that completely consumes the expected savings:
The Optimization Play: An enterprise builds a copilot that cuts verification time in half, reducing the internal cost from $2,007 to $1,000.
The Volume Rebound: Because verification is cheaper, the business instantly demands more coverage—expanding checks to more accounts, more stakeholders, and deeper goal tiers.
The Bottleneck Shift: The saved capacity is completely swallowed by the expanding demand, pushing the manual constraint onto the next human layer—the Senior Compliance Director or CCO who must sign off on the exploding volume of reports.
Incremental efficiency improvements cannot bridge an 803x cost gap. No amount of process mapping or analyst copiloting will ever drive a $2,007 manual execution down to a $2.50 physics floor.
The only mathematically sound escape from the Jevons trap is a structural inversion of the architecture. You must shift from human reconstruction labor to an automated, federated telemetry routing engine that completely eliminates the human from the execution loop.
The Incumbent Death Sentence: Why Legacy Platforms Cannot Code Their Way Out
When a disruptive paradigm shifts an industry, incumbents almost always promise that the functionality is on their upcoming product roadmap. In the CX measurement space, however, legacy platforms like Qualtrics and Medallia are facing a structural limitation, not a feature deficit. Their entire architectures are fundamentally misaligned with behavioral verification.
Let’s look at the competitive realities across the current enterprise software landscape:
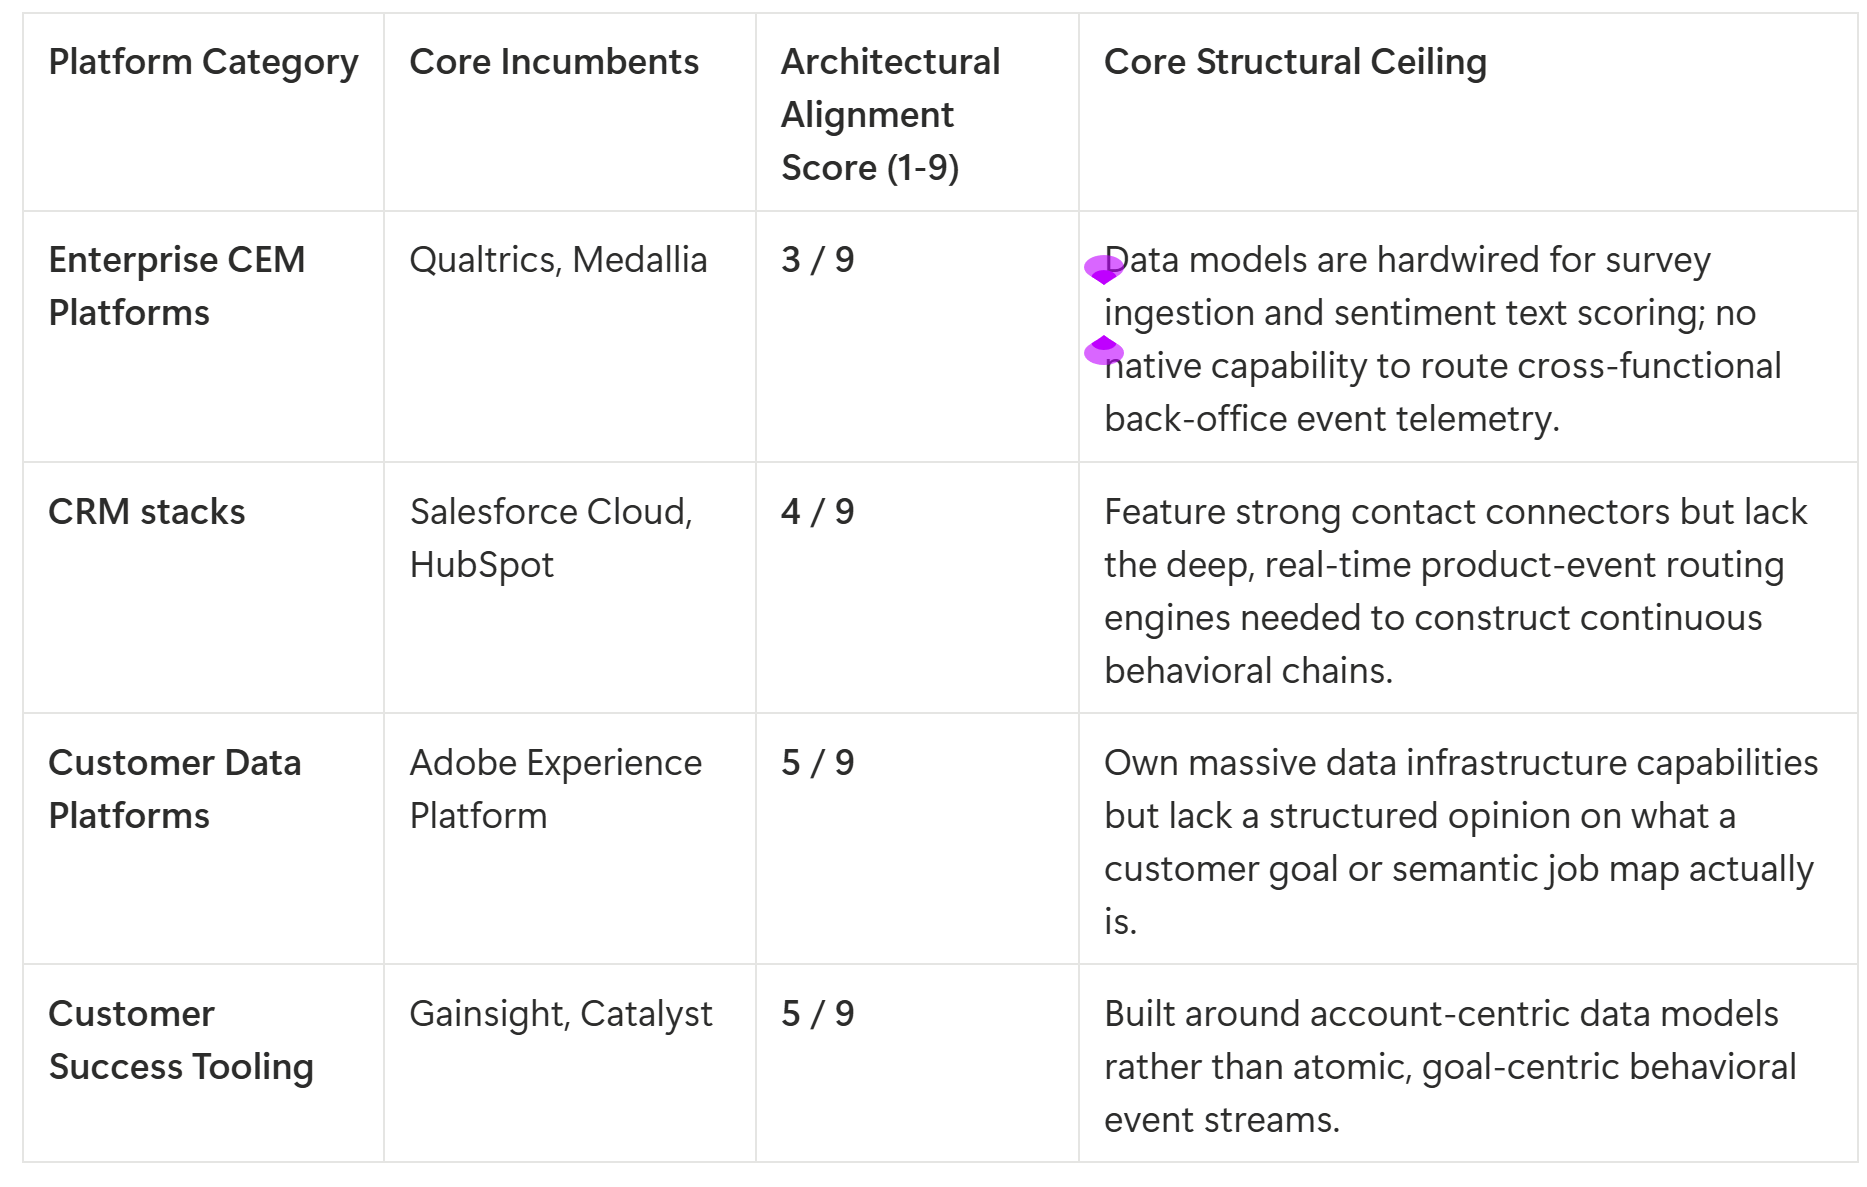
Incumbents are trapped by what Clayton Christensen defined as the Innovator’s Dilemma. Their multi-hundred-thousand-dollar annual enterprise contracts are justified by the sheer volume of survey collection, reporting throughput, and benchmark licensing they sell to corporate marketing departments.
To build a true behavioral evidence engine, they would have to admit in writing to their boards and buyers that their flagship metrics are fundamentally contaminated proxies. That admission is commercially suicidal inside their current P&L frameworks.
The technical lockout is further intensified by the three-layer moat required to run a behavioral verification architecture:
A Compliance-Cleared Telemetry Substrate: Running live pipelines through billing, product, and support infrastructure requires premium GRC configurations, intensive penetration testing, and pre-cleared legal data access agreements.
A Federated Data Network: A distributed framework where customer systems operate as supply nodes, allowing verification logic to execute within the customer’s perimeter without copying raw data.
A Goal-to-Telemetry Routing Engine: A specialized semantic layer capable of mapping abstract customer success plans directly to atomic database and telemetry events.
The CMO-CCO Cold War: Governance, Comp Decoupling, and the Institutional Flip
The single greatest barrier to deploying a behaviorally verified customer model is not technical complexity; it is political governance. Every enterprise operating under the legacy model is currently locked in a structural cold war between the Chief Marketing Officer and the Chief Customer Officer.
The CMO typically controls the massive experience measurement budget and owns the high-level, aggregated NPS and CSAT dashboards that are displayed to the board. The CCO is handed accountability for net revenue retention, yet is forced to operate using the CMO’s self-report survey instruments instruments.
To break this gridlock, an organization must implement two non-negotiable governance interventions before writing a single line of production code:
The CMO-CCO Co-Sponsorship Charter
The enterprise must execute a binding internal charter that formally splits accountability and transfers resources. The RACI matrix must look exactly like this:
┌────────────────────────────────────────────────────────┐
│             CMO-CCO CO-SPONSORSHIP CHARTER             │
├───────────────────────────┬────────────────────────────┤
│   Chief Marketing Officer │ Chief Customer Officer     │
├───────────────────────────┼────────────────────────────┤
│ • Accountable for         │ • Accountable for          │
│   decommissioning legacy  │   behavioral evidence      │
│   NPS/CSAT dashboards.    │   production & pipelines.  │
│                           │                            │
│ • Transatlantically       │ • Assumes control of the   │
│   transfers budget to the │   reallocated telemetry    │
│   telemetry substrate.    │   measurement budget.      │
└───────────────────────────┴────────────────────────────┘
The Comp Decoupling Workstream
The behavioral verification layer will receive unmanipulated evidence if and only if front-line teams are no longer incentivized to distort the data data.
Organizations must completely remove survey metrics from agent and customer success manager (CSM) compensation formulas. This requires a dedicated legal and HR co-design process to amend employment contracts, deployed via a disciplined rollout sequence:
[HR & Legal Co-Design] ──► [Pilot Pod Cohort] ──► [Regional Expansion] ──► [Global Enforcement]“When agents are paid on Customer Satisfaction, the verification layer receives manipulated evidence. Perfect execution means compensation formulas tied to behavioral goal-attainment, not self-report.”
If you leave NPS or CSAT targets in the front-line compensation matrix, your teams will instantly find ways to game, time, and manipulate the incoming telemetry data to protect their quarterly bonuses. Clean incentives are the prerequisite for clean behavioral data.
The Outcome Verification Liability Architecture: Transforming Attestation Into Bounded Observation
When you move away from subjective surveys and begin delivering hard, behavioral verification data, your legal relationship with your customers changes completely. If your platform generates a report stating that an enterprise account has verifiably achieved its contractual deployment milestones, that report becomes a piece of financial evidence used in renewal and procurement negotiations.
If a software bug or a schema error misclassifies a broken workflow as a completed goal, the enterprise faces severe liability exposure if the account subsequently churns due to undetected failure. To protect the business from this vulnerability, the platform must be governed by an Outcome Verification Liability Architecture built on three strict contractual pillars:
The Observational Disclaimer: Every dashboard export, API payload, and board-level report must contain an explicit legal disclaimer specifying that the system delivers observational behavioral evidence consistent with goal attainment, not a legally binding warranty of customer success.
Capped Indemnity: Any liability claims arising from mis-verified attestation events must be legally capped at a strict multiple of the customer’s active software subscription value.
The Arbitration Layer: The contract must mandate a binding arbitration process for any post-verification disputes, completely preventing a customer from dragging a methodology disagreement into a costly public jury trial.
By formalizing these boundaries in the standard contract template prior to entering the market, you transform a potentially dangerous legal vulnerability into a highly stable, board-defensible enterprise asset.
The Four Inversions: Architecting a Zero-Marginal-Cost Telemetry Fabric
To permanently collapse the 803x cost gap and bypass internal data gatekeeping, the platform must execute four sweeping structural inversions. These moves shift the fundamental physics of how customer data is processed and commercialized.
The CapEx Amortization Inversion
The legacy model treats behavioral data access as a highly variable, per-execution procurement nightmare. Every check requires waiting eleven weeks for a security review and spending $7K–$47K in data engineering overhead.
The inversion is to build a compliance-cleared, federated telemetry substrate once. By sinking the initial capital into pre-approved enterprise connectors, the marginal cost of routing a new account’s behavioral data drops to near-zero, transforming a variable operational drag into an amortized corporate asset.
The Labor Inversion
Traditional verification relies on human analysts running workshops to manually map customer success plans to dashboard metrics.
The inversion uses a pre-trained, machine-learning tiering engine to automatically ingest raw customer success plans and contracts. The system auto-generates candidate behavioral evidence chains and event taxonomies. The human executive is completely removed from the execution loop and placed strictly into a high-level causal ratification role.
The Network Inversion
Instead of pulling massive, sensitive operational logs out of a customer’s environment and into a centralized vendor database—which triggers intense resistance from information security teams—the network model federates the verification logic. The logic executes locally within the customer’s secure data perimeter. Only the binary verification verdict is routed out, transforming the customer’s existing data infrastructure into a decentralized supply node for the proof economy.
The Demand Inversion
Stop selling survey-replacement tools to marketing budgets. Instead, create an entirely new corporate demand category: the board-defensible outcome metric.
By packaging verified goal-attainment evidence as an alternative currency for renewal underwriting, you bypass the crowded software feature war and open an un-attackable procurement category that funds itself through recovered revenue.
The Implementation Blueprint: From Wedge Account to Global Moat
You do not capture a $400-million-dollar strategic value pool by attempting a multi-million-dollar, multi-region software implementation on day one. That path leads directly to corporate organ rejection, budget depletion, and political exhaustion. Instead, you deploy capital through a highly disciplined, four-stage real options architecture.
┌────────────────────────┐
│  Option 1: The MVPr    │
├────────────────────────┤
│ • 1 Wedge Account      │ ──► [Kill Gate: Written Acceptance at Renewal]
│ • 2 Data Sources       │
└────────────────────────┘
            │
            ▼
┌────────────────────────┐
│ Option 2: Hardening    │
├────────────────────────┤
│ • 3-5 Regional Clients │ ──► [Kill Gate: Two Paying Clients Reference Substrate]
│ • Real-time Pipelines  │
└────────────────────────┘
            │
            ▼
┌────────────────────────┐
│  Option 3: Moat Lock   │
├────────────────────────┤
│ • Vertical Templates   │ ──► [Kill Gate: Three Verticals Lock Standards]
│ • Exclusivity Contracts│
└────────────────────────┘
            │
            ▼
┌────────────────────────┐
│ Option 4: Federation   │
├────────────────────────┤
│ • Global Scale         │ ──► [Category Domination ($400.9M Strategy Matrix)]
│ • 21,600 Executions    │
└────────────────────────┘
Let’s look at the operational requirements of the first ninety days to see exactly how this sequence begins on the ground:
Weeks 1–3: The Ingestion and Normalization Phase
The system connects to the wedge account’s customer success plan repositories and CRM contract histories. It extracts their unstructured, declared objectives and normalizes them into strict canonical job-to-be-done syntax (Verb + Object + Contextual Clarifier). The CCO reviews and ratifies the normalized output.
Weeks 4–6: The Evidence Mapping Phase
The tiering engine processes the normalized job statements and classifies them into complexity buckets (simple, moderate, complex multi-stakeholder). It automatically pattern-matches the goals against the account’s active database schemas to emit candidate behavioral evidence chains. The analytics lead reviews the confidence scores and approves the routing map with a single click.
Weeks 7–9: The Substrate Connection Phase
Read-only event pipelines are wired into the two primary operational data sources—product telemetry and billing logs. Because the data access is tightly scoped to specific binary event timestamps rather than bulk extraction, the compliance and info-sec review clears inside days rather than months.
Weeks 10–12: The Dashboard and Compensation Realignment
The live event confirmation layer begins streaming data into a stratified behavioral dashboard. Concurrently, the comp decoupling workstream launches its pilot pod cohort, moving front-line teams away from survey metrics and onto verified goal-attainment density trackers.
By the end of week twelve, the CCO can display a telemetry-backed, auditable outcome completion rate for the wedge portfolio directly to the CFO.
Summary: The New Currency of Enterprise Trust
The customer experience industry is approaching an inevitable day of reckoning. The practice of spending millions on software modules to collect attitudinal surveys, while ignoring real-time behavioral evidence of goal failure, is a luxury that modern corporate margins can no longer tolerate.
When you strip away the theater, the math becomes unassailable: a customer relationship is either producing behavioral evidence of goal achievement, or it is silently decaying toward zero. Transitioning from a manual, survey-dependent paradigm to a federated, behaviorally verified architecture unlocks over $400.9 million in annual strategic value across a global footprint—collapsing per-execution verification costs from $2,007 down to a $2.50 physics floor.
This transformation is not a software upgrade; it is a profound reallocation of enterprise trust. It forces the organization to confront the hard gap between what its dashboards claim and what its customers are actually living. The tools, the compliance templates, and the mathematical frameworks are ready. The only question left for leadership to ponder is simple:
Are you prepared to tell your board exactly what percentage of your customers actually achieved the goal they paid you to deliver—or will you hand them another Net Promoter Score?
To access the complete Implementation Strategy Guide, view the reports, decks, and videos, and interface directly with the specialized deep analysis multi-agent model, click the link below.
Access the Deeper Analysis Model & NotebookLM Oracle
Please note: The system (and platform) require that several validation gates be used in order to justify the next stage. I bypassed those for this example. I also created an arbitrary problem statement and injected an OSINT deep research report using a special prompt. You might scope this differently. This is an example only.
Is your organization interested in true innovation? Or does it prefer to just look busy and hire consultants? The world is changing quickly. If you’re not adapting to it, you’re not innovating. I work with organizations who are serious about the subject and are willing to challenge the current paradigm. Is that you? (my availability is limited)
Book an appointment: https://pjtbd.com/book-mike
Email me: mike@pjtbd.com
Call me: +1 678-824-2789
Join the community: https://pjtbd.com/join
Follow me on 𝕏: https://x.com/mikeboysen
Articles - jtbd.one - De-Risk Your Next Big Idea
Always attack…Never defend
