


Free Access to Research Artifact
If you point an LLM at the public internet, you get pattern-matching and slide-deck filler—a race to the middle executed at lightspeed. In modern strategy, the model is not the moat; the proprietary data payload you query is. To prove this, I’m opening my research vault: every week, I compile a complete, industry-wide research payload (job maps, physics floors, and inversion plans) into a secure Google NotebookLM workspace. If you have a Gmail account, you can enter the workspace, query the raw math, and stress-test the data yourself. Today’s artifact is about CRM Operation Entropy. 👈
Every Monday morning, executive teams across the globe gather in beautifully appointed boardrooms to participate in a sacred corporate ritual: the weekly forecast roll-up call. Revenue leaders look their CEOs in the eye, sign their names to multi-million dollar projections, and promise absolute certainty.
But if you peel back the layers of executive swagger, the glossy dashboards, and the complex CRM workflows, you’re left with an uncomfortable truth. Your forecast was never actually built on buyer reality. It was built on a sales representative’s paycheck.
When we treat a forecast number as both a neutral measurement of reality and a high-stakes compensation trigger, a mathematical law locks in. The data fields instantly stop optimizing for accuracy and begin optimizing for commission math. The result? A massive, invisible tax on corporate efficiency that costs enterprise organizations a staggering $153 billion globally every single year.
This isn’t a human discipline problem or a training issue; it is a fundamental architecture failure. Let’s look at the data to dismantle the forecasting matrix and discover what happens when we replace human testimony with cryptographic evidence.
Takeaway 1: The “Tuesday Afternoon” Phenomenon (The Distortion Pivot)
The exact moment your forecast dataset goes from an objective metric to a gamed narrative can be localized down to a precise 48-hour window. In the revenue operations world, this is known as the Distortion Pivot.
Sales reps do not update their deal stages based on the glacial pace of corporate legal reviews or procurement approvals. They update them based on the calendar cutoff of their commission accelerators.
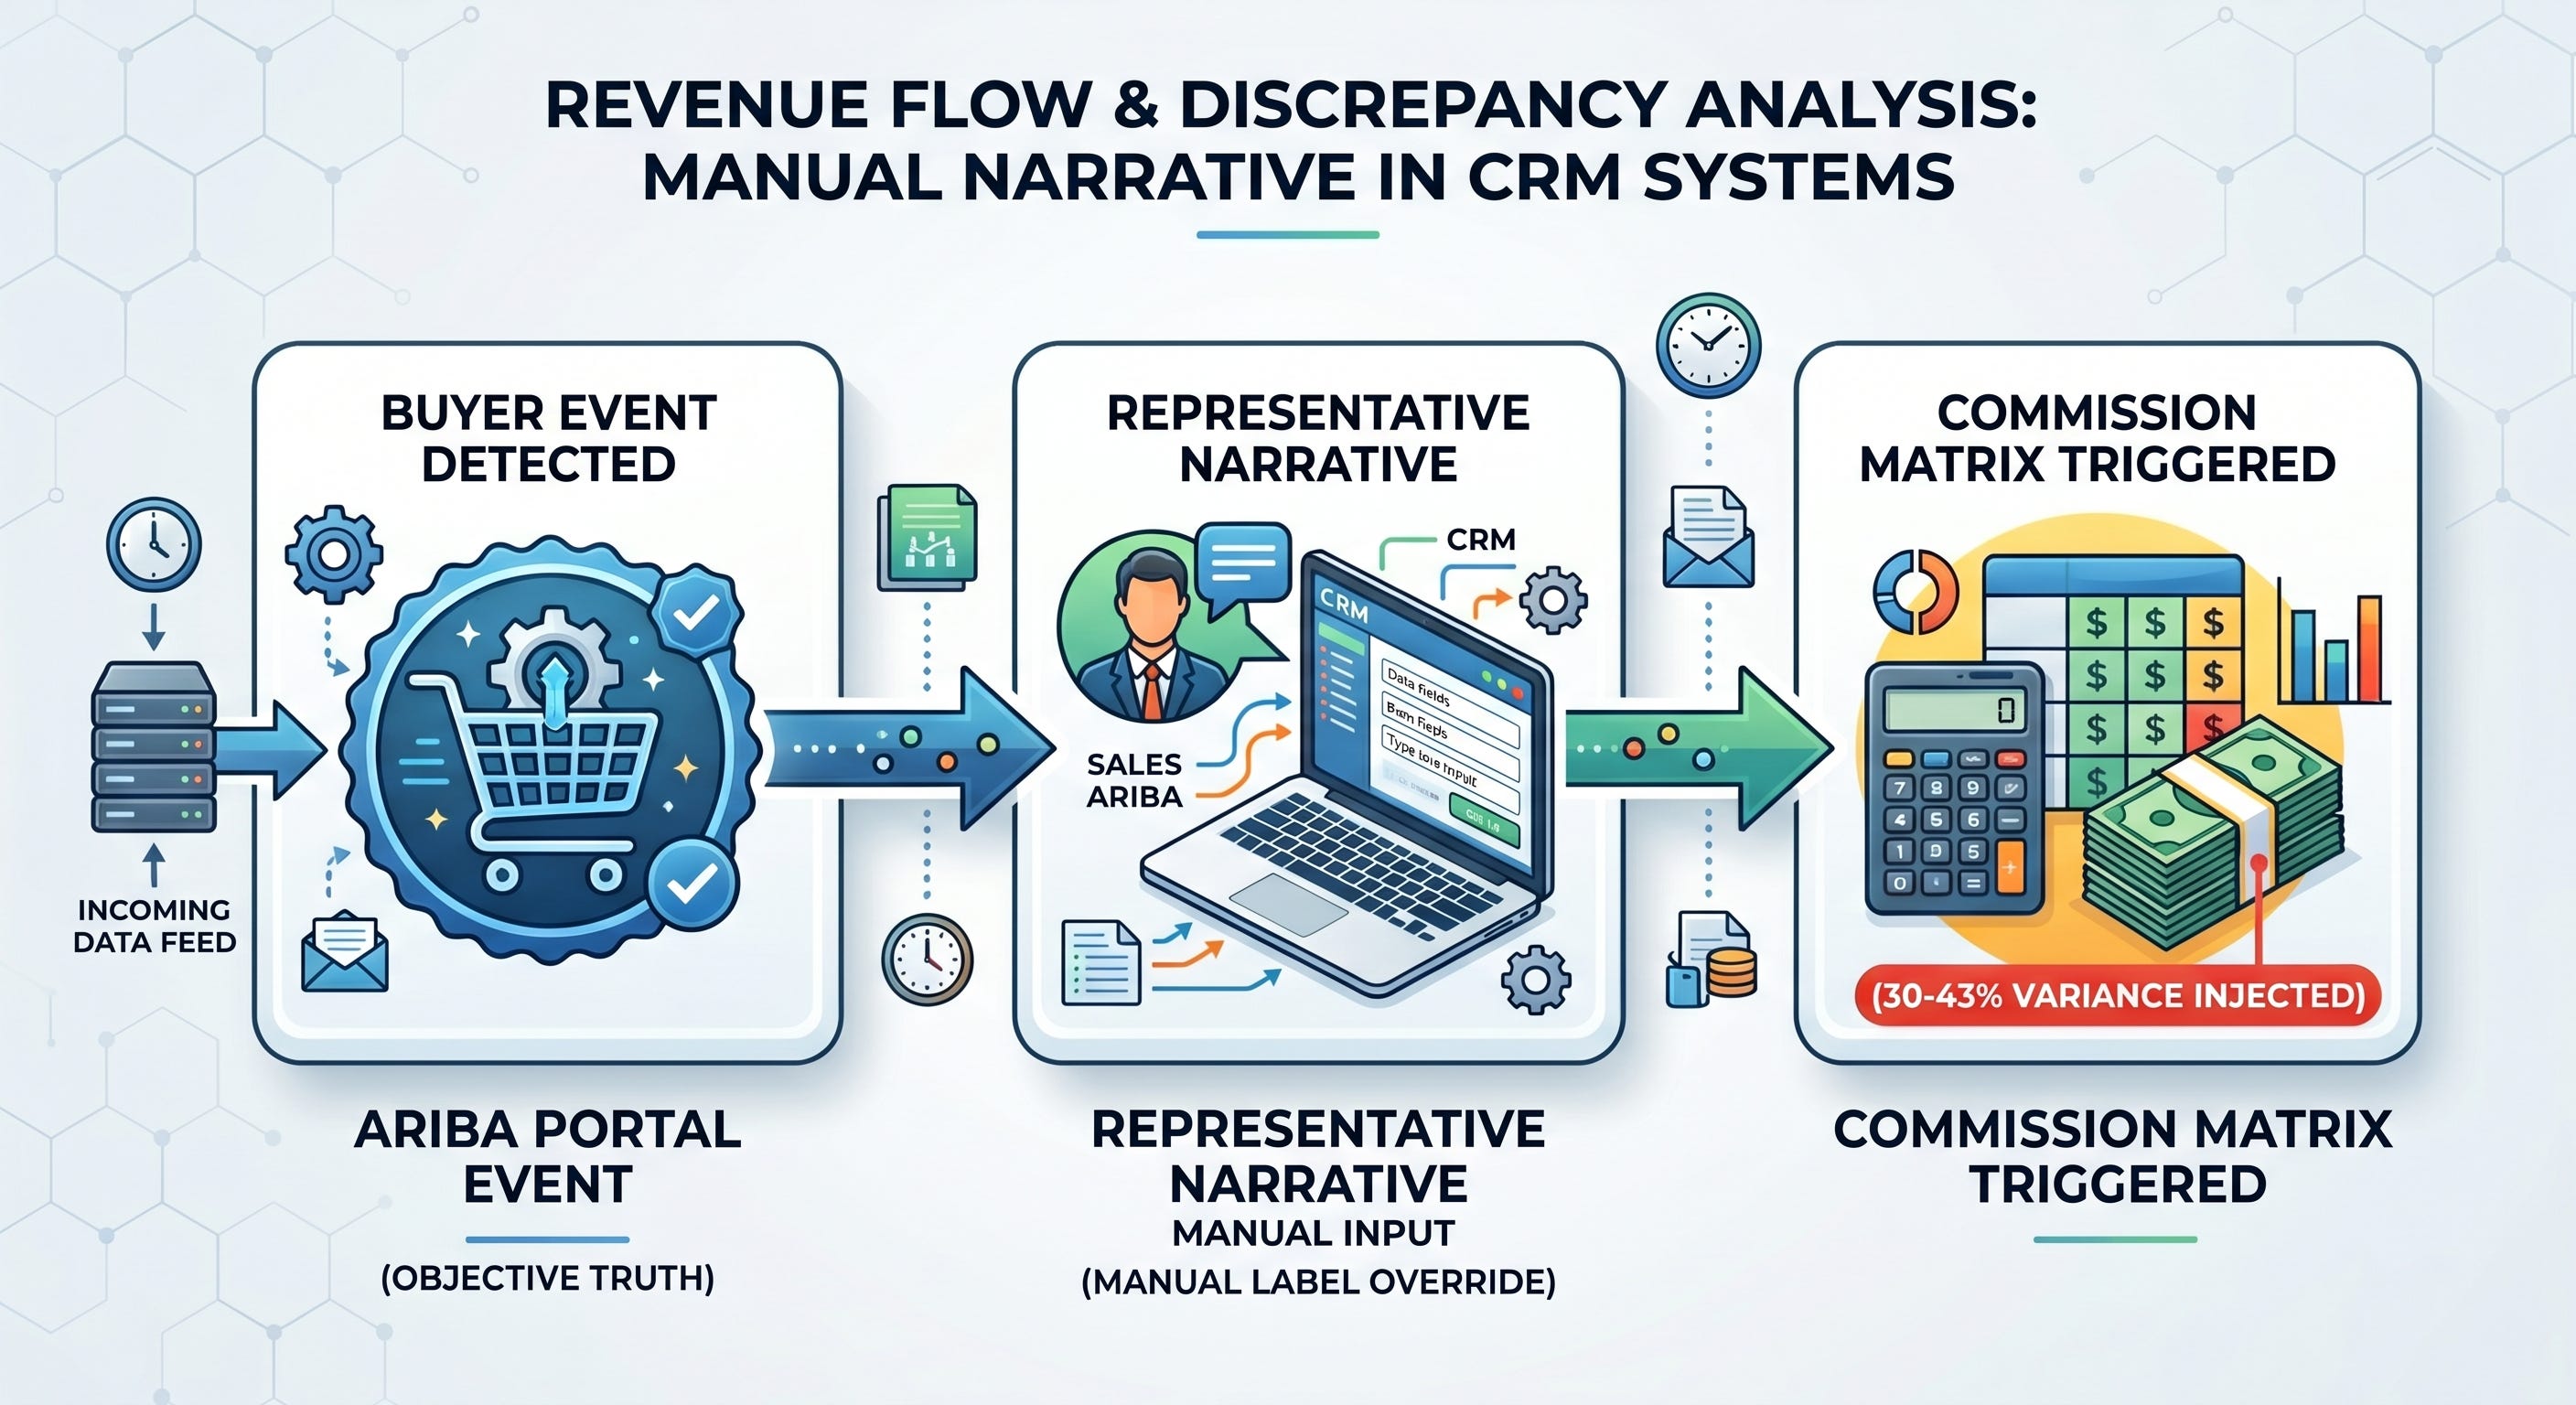
Forensic audits of global enterprise sales pipelines expose a clear behavioral pattern: between 30% and 43% of total quarter-end forecast variance is injected into the system during the private preparation window immediately preceding the forecast lock. A representative sits down on a Tuesday afternoon, calculates the exact distance to their on-target earnings (OTE) accelerator threshold, and unilaterally moves marginal opportunities into the “Commit” column.
“It’s Tuesday afternoon of week 11... They need $X to hit my OTE, so I need to commit $Y in pipeline. It’s not malicious — it’s comp math.”
By the time that number hits the executive board deck, it has been stripped of its underlying buyer telemetry. The system has successfully optimized for a rep’s commission surface rather than a buyer’s actual purchase intent.
Takeaway 2: The “Rep Narrative Tax” Is Bleeding You Dry
Most Chief Financial Officers view forecasting as a low-cost, internal administrative process. They calculate the cost of their forecasting stack by adding up CRM licenses and the headcount of a few Sales Ops analysts. This perspective is a costly misunderstanding of corporate accounts payable.
When we evaluate the fully loaded cost of manual forecast reconciliation—including the endless hours senior leaders spend cross-checking notes, pulling call snippets, and building ad-hoc spreadsheets because nobody trusts the CRM—the numbers become staggering.
The Cost Per Forecast Execution
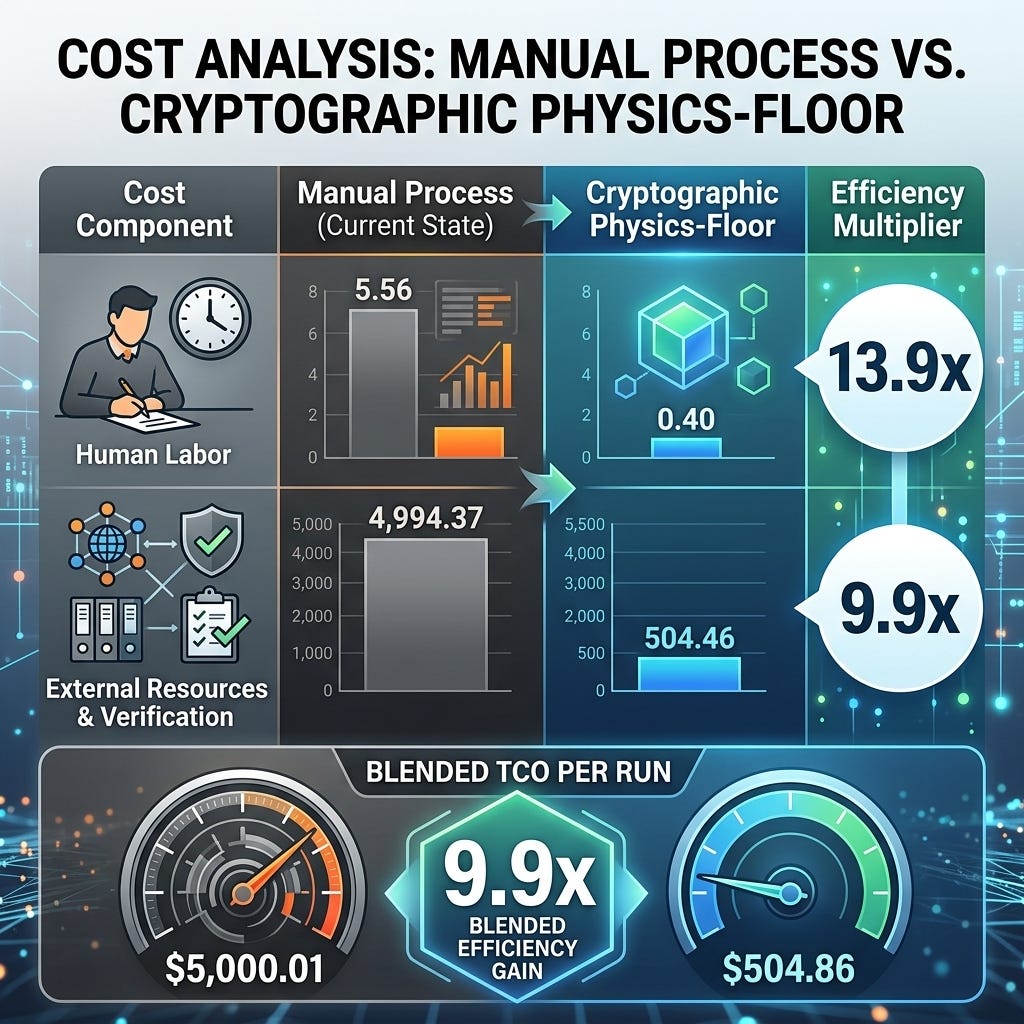
The multi-thousand-dollar overhead per commit represents the Rep Narrative Tax—the money companies pay to turn subjective employee assertions into a board-ready presentation. When scaled across a typical enterprise run-rate of 12,000 regional executions per year across 140 global operating units, organizations are spending over $7.55 billion annually just to maintain an elaborate data-cleansing loop.
Takeaway 3: The 63% Silent Killer (Friction Abandonment)
While spending billions on data cleanup is painful, it pales in comparison to the revenue that vanishes because your forecasting cycle time is too slow.
Because modern CRMs have no native structural capability to separate a representative’s subjective opinion from a buyer’s confirmed action, revenue operations leaders are trapped in a constant state of “Slog Tax”. They must hunt down evidence across email silos, Slack Connect channels, and contract repositories.
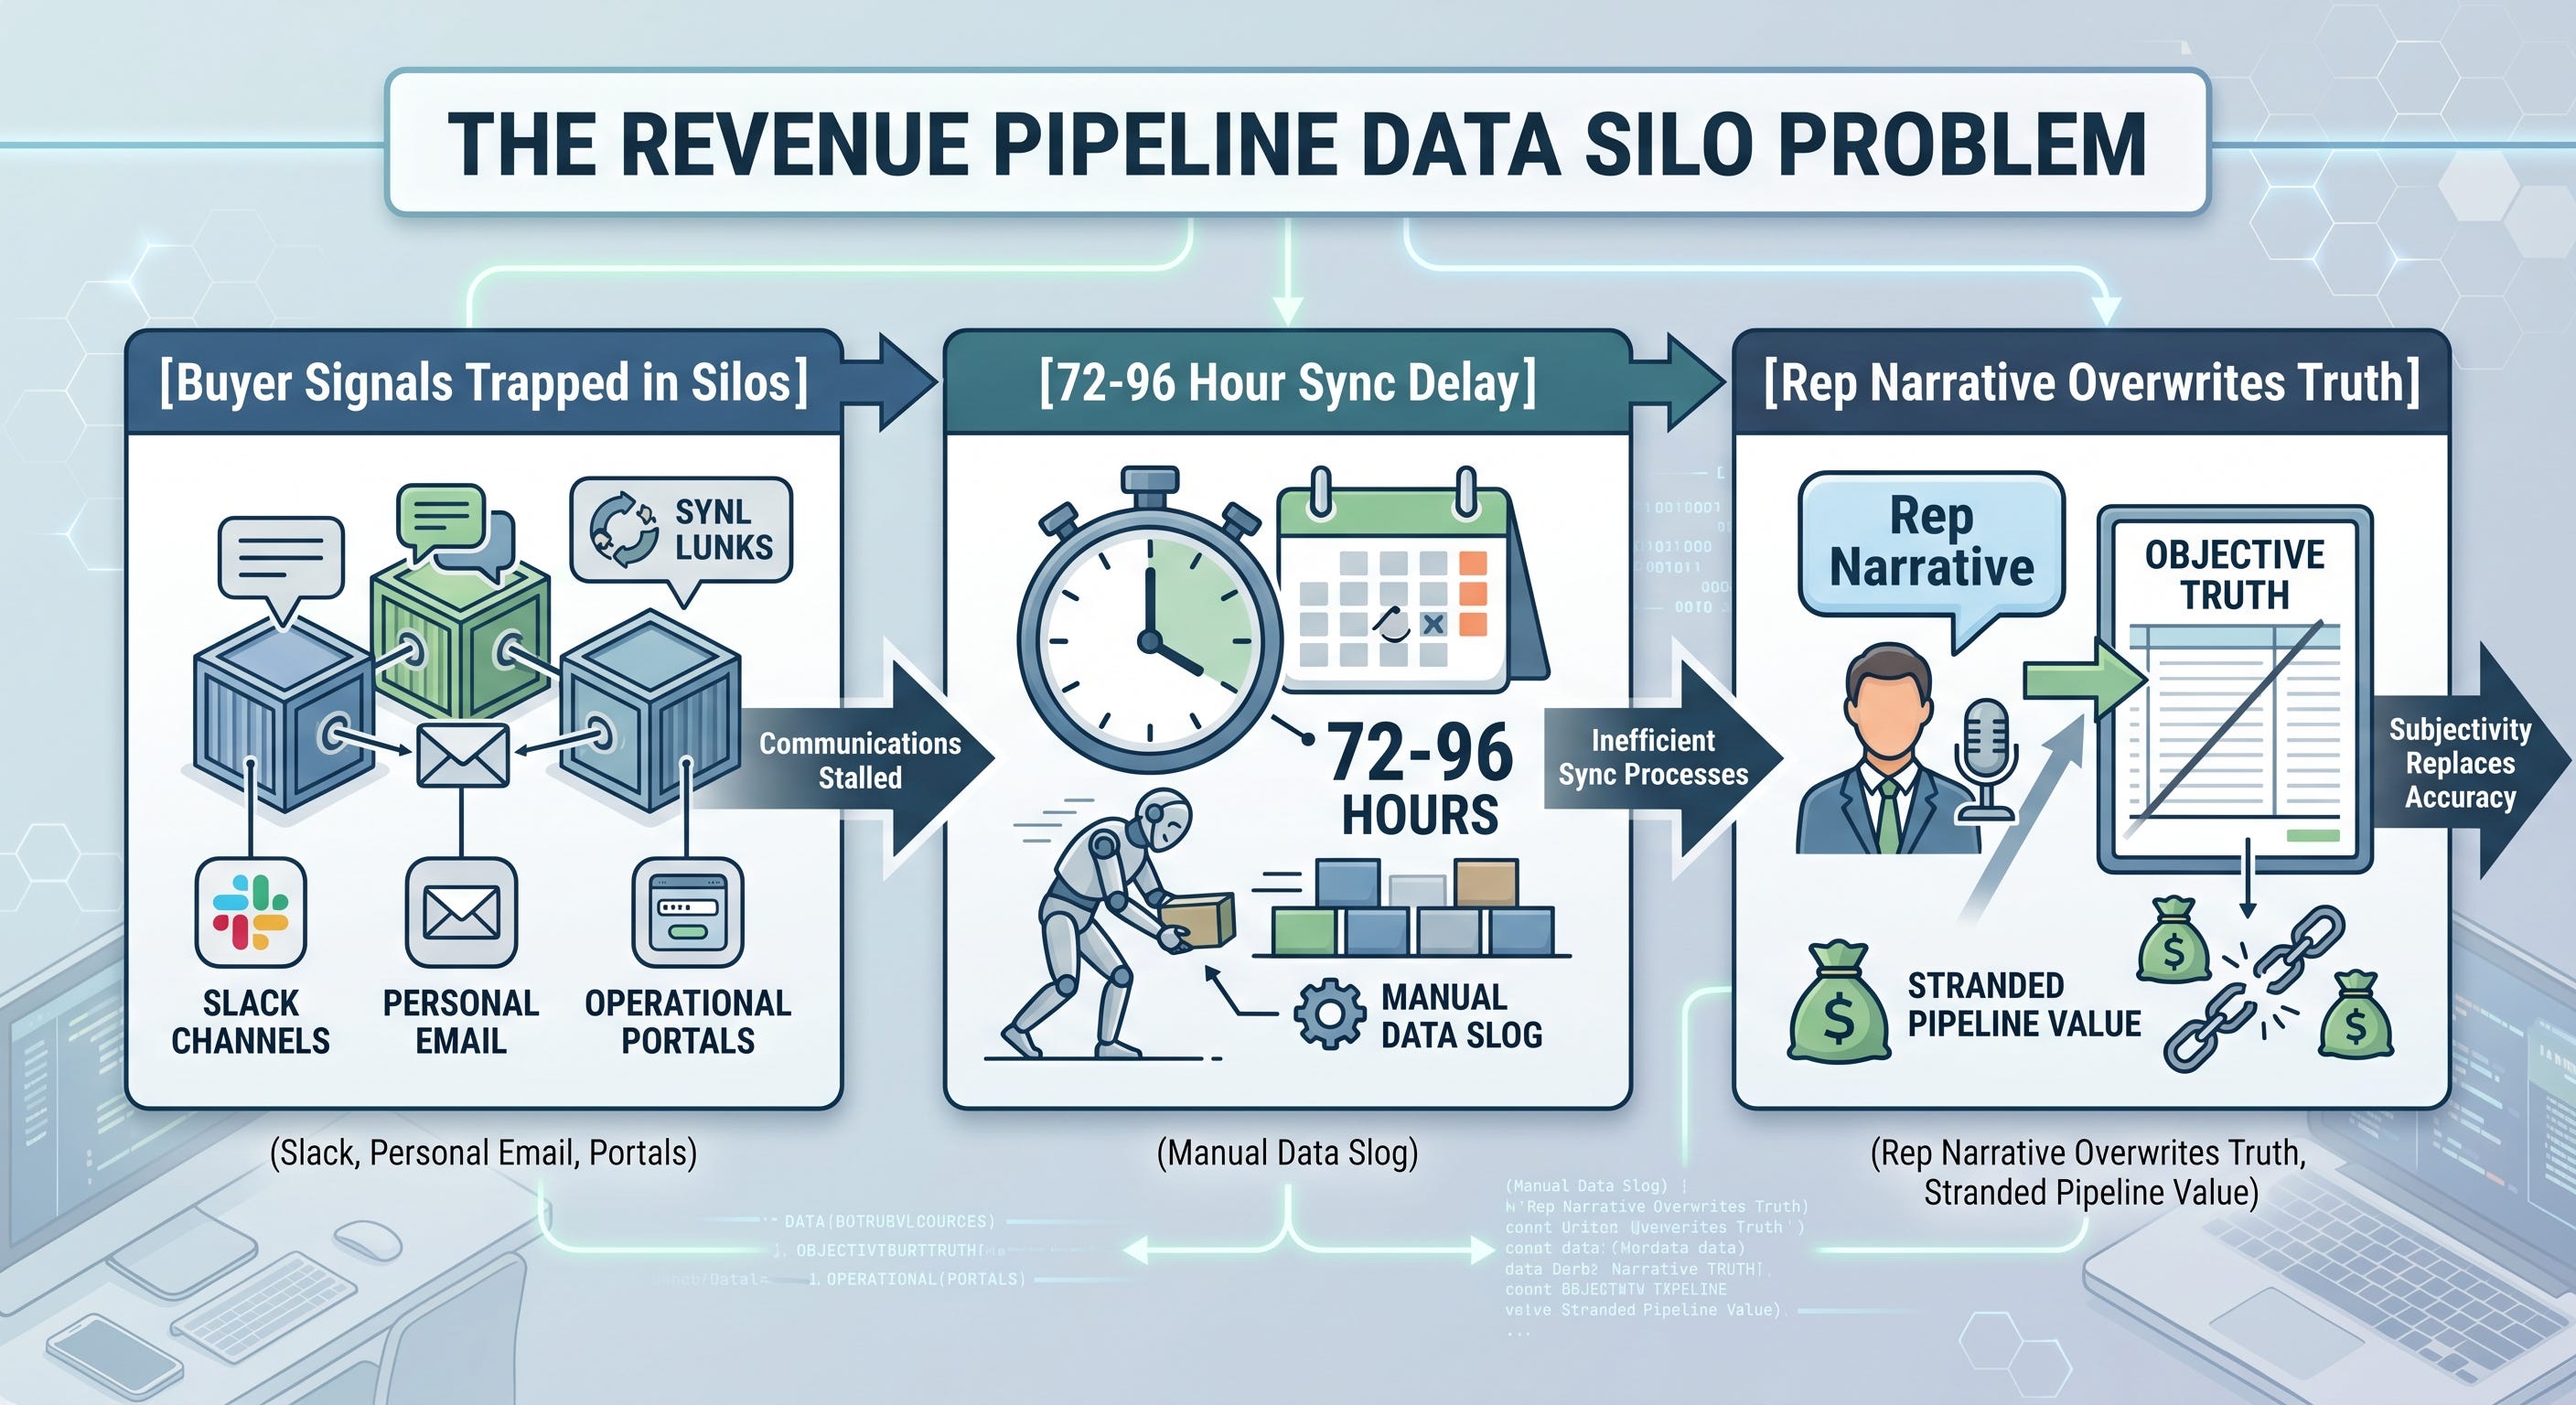
This manual interrogation loop takes so long and generates so much friction that 63% of forecast-bound transactions are abandoned or deprioritized mid-cycle. Deals slip quarters not because the customer said no, but because the enterprise could not produce a defensible data trail fast enough to deploy engineering resources, activate executive sponsors, or issue correct pricing guidelines.
This silent operational friction results in a massive $132.3 billion in lost transaction pipeline and relationship value globally every year.
Takeaway 4: Why Pathway B (Sustaining Overlays) Is a Seductive Mathematical Trap
When revenue leaders finally realize their forecasting process is broken, they almost always reach for the same playbook: buy a specialized revenue intelligence overlay (like Gong or Clari), spin up a centralized data warehouse (like Snowflake), and write a tighter forecast-checking manual.
This is Pathway B (Sustaining Innovation), and it is a dangerous mathematical trap.
The problem boils down to a phenomenon known as the Jevons Paradox. For the traditional, rep-mediated forecast workflow, the strategic elasticity factor sits firmly at:
Because E is greater than 1.0, any efficiency gain you introduce into the pipeline will immediately trigger a non-linear volume rebound.
If you deploy an overlay tool that cuts rep data-entry friction by 25%, you don’t actually bank the savings. Instead, the field organization repurposes that saved time into generating more unverified pipeline entries and running more rapid commit modifications.
The volume response expands exponentially until it crashes directly into your next human constraint: senior revenue reviewers. These senior individuals cost roughly $180 per hour and can only process about 150 commits per week. Within two quarters, your software spend has inflated, your operational savings have evaporated into management overtime, and your final forecast variance remains completely unchanged.
Takeaway 5: Stop “AI-Cleaning” the Lie—Delete the Input Field
The dominant technology incumbents want you to believe that the future of revenue operations lies in advanced predictive analytics. They want to sell you an AI model that reads your gamed CRM dropdown data, references historical rep performance art, and attempts to guess the “real” probability of a close.
This approach is fundamentally flawed. If your data substrate is corrupted at the moment of entry by compensation incentives, your artificial intelligence is simply learning how to rationalize and report a more sophisticated version of a lie.
Pathway C—the Disruptive Inversion strategy—argues that we should stop auditing the lie entirely and apply a subtractive scalpel to the CRM schema itself.
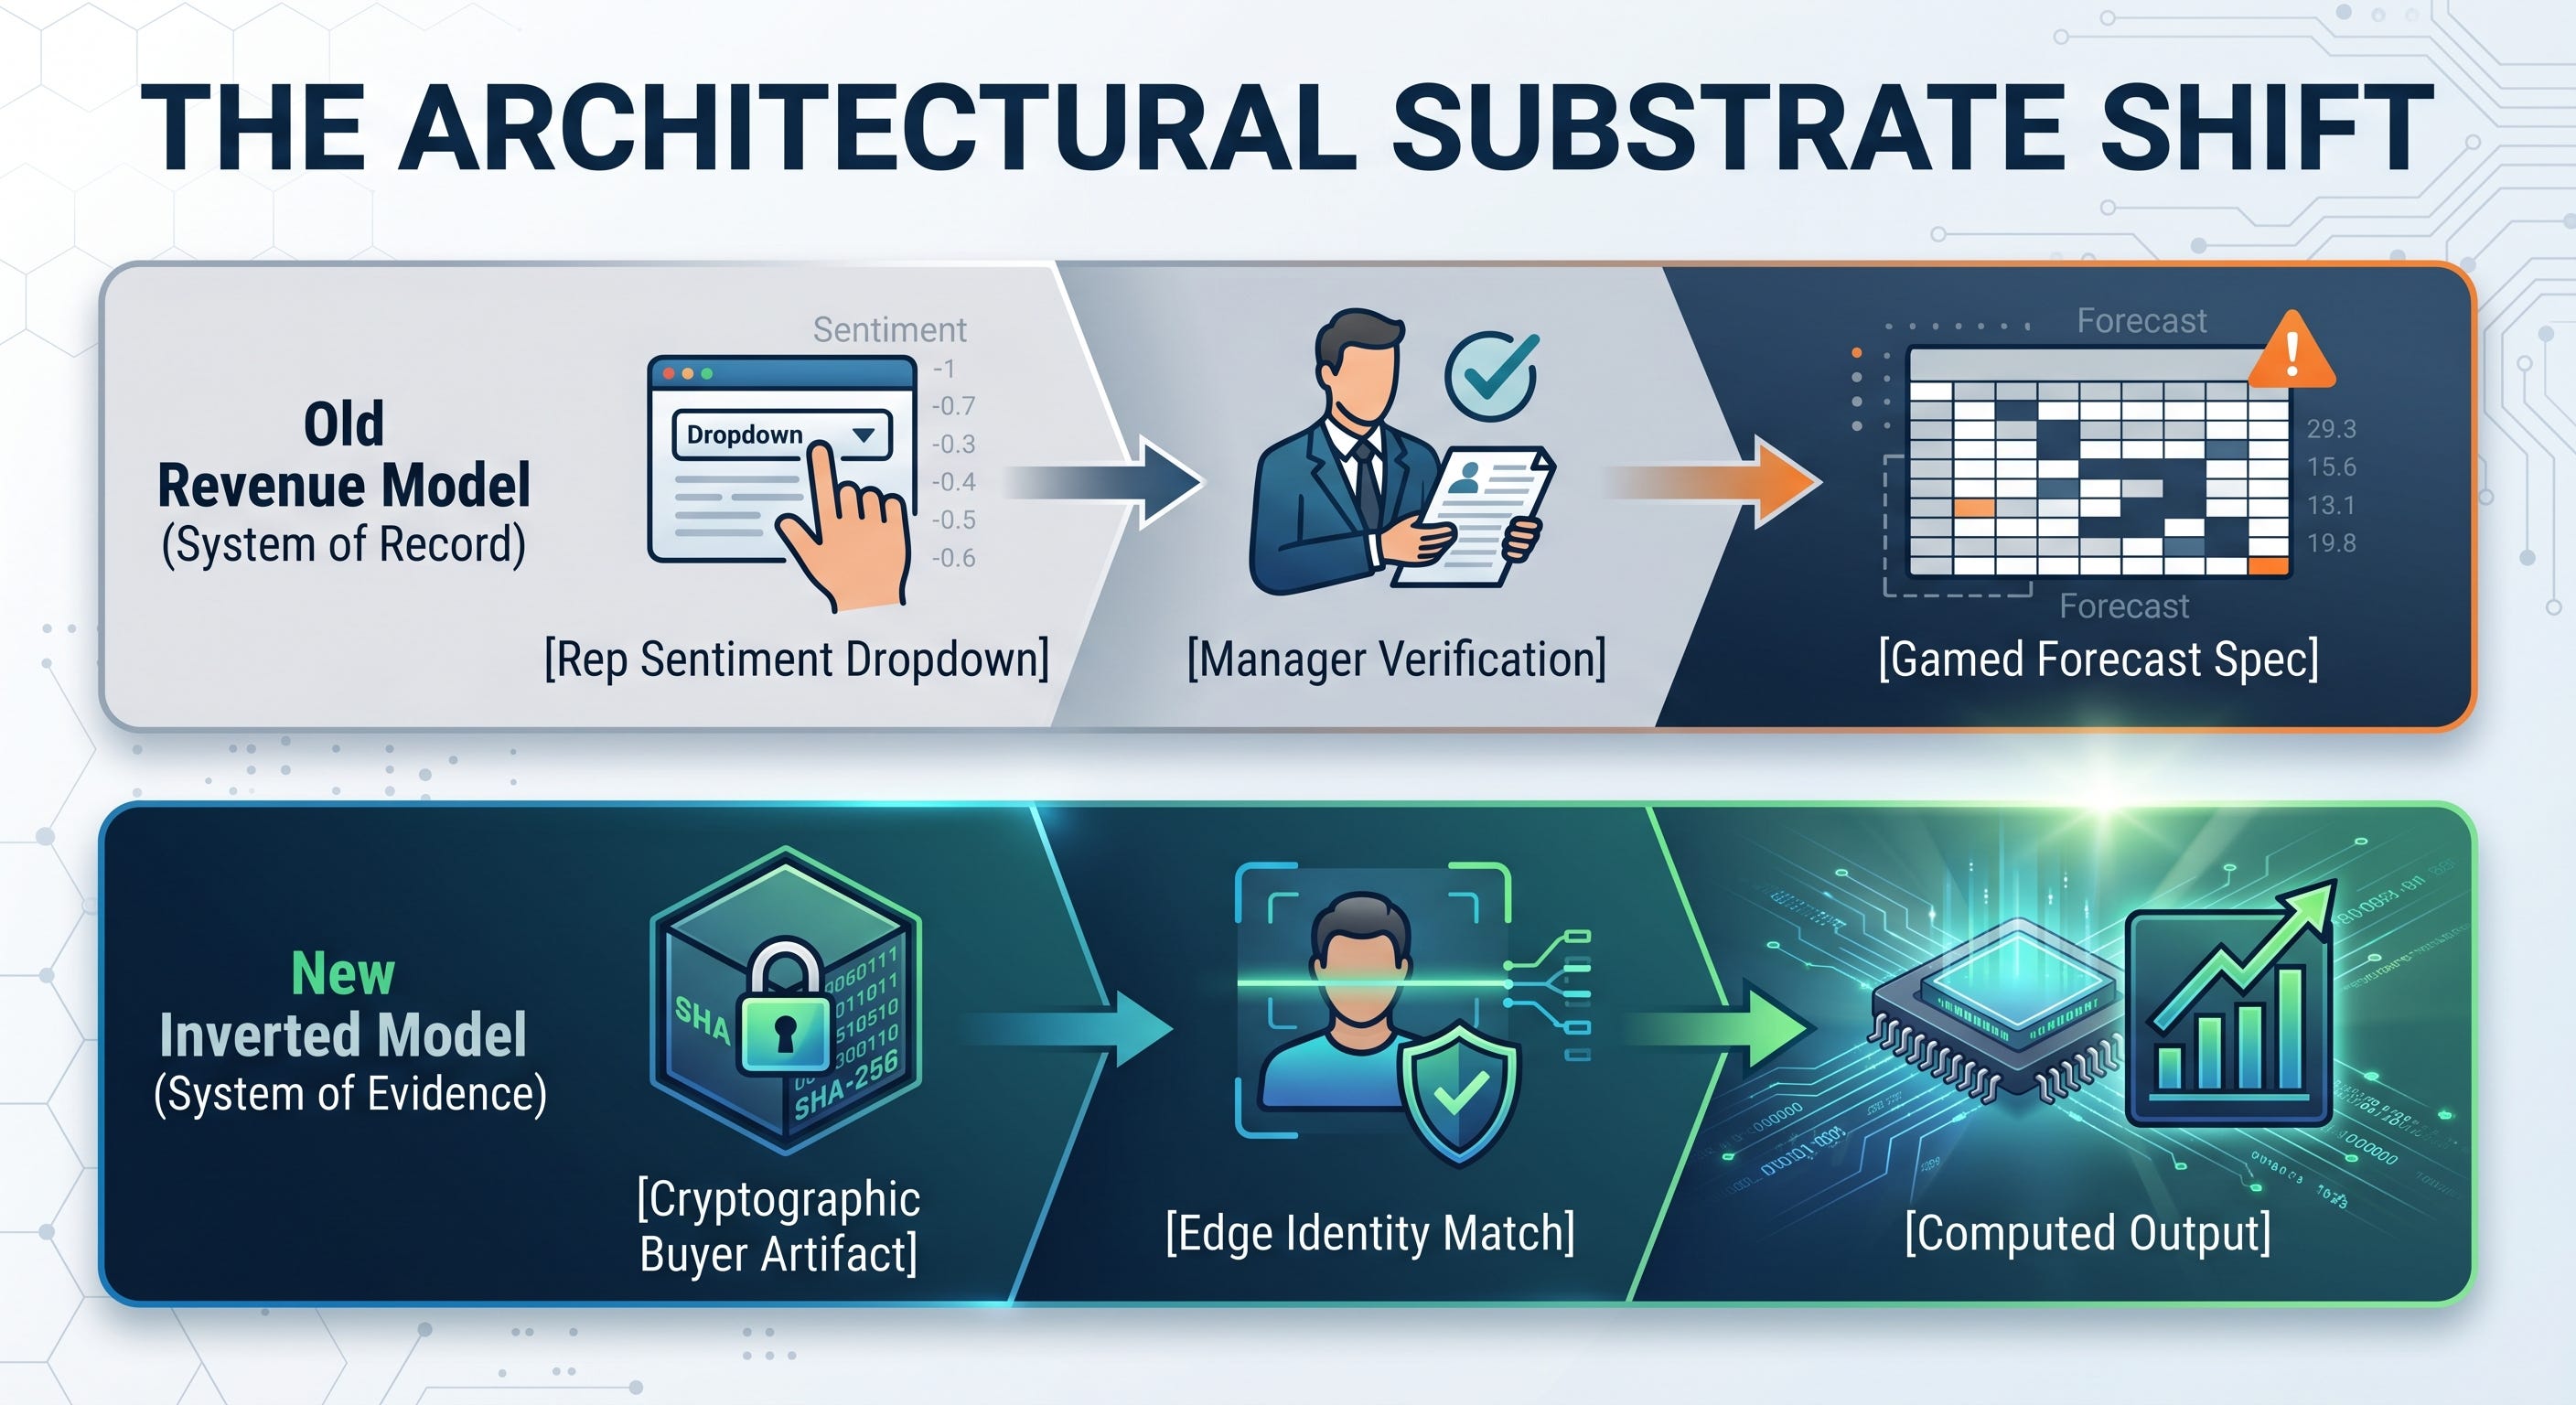
True forecast defensibility requires moving from a System of Record (what people said happened) to a System of Evidence (what the digital buyer-side artifacts prove happened). This shift means taking the following concrete architectural actions:
Delete Free-Text and Manual Dropdowns: Hard-remove the “Forecast Category” and “Commit” dropdown fields from the CRM interface completely. Reps should be physically stripped of the right to have a subjective write-privilege opinion on deal state.
Implement Authoritative Artifact Gates: Hard-code a backend protocol that physically disables the CRM stage transition until a verified SHA-256 cryptographic hash of a buyer-generated digital artifact is linked to the deal.
Transition to Read-Only Forecast Substrates: Let the pipeline calculate its own probability weights automatically by scanning the presence, velocity, and freshness of real buyer telemetry.
Takeaway 6: The “Ghost Auditor” Syndrome and the Sprawl of 22-27 Systems
If you ask an internal IT director how many software platforms are involved in user-buyer relationships, they will look at their single sign-on logs and tell you the number is around five to seven.
If you run a deep operational audit, the empirical reality will shock you: the average mid-market to enterprise revenue team has a sprawling footprint of 22 to 27 disconnected tools holding critical buyer signals.
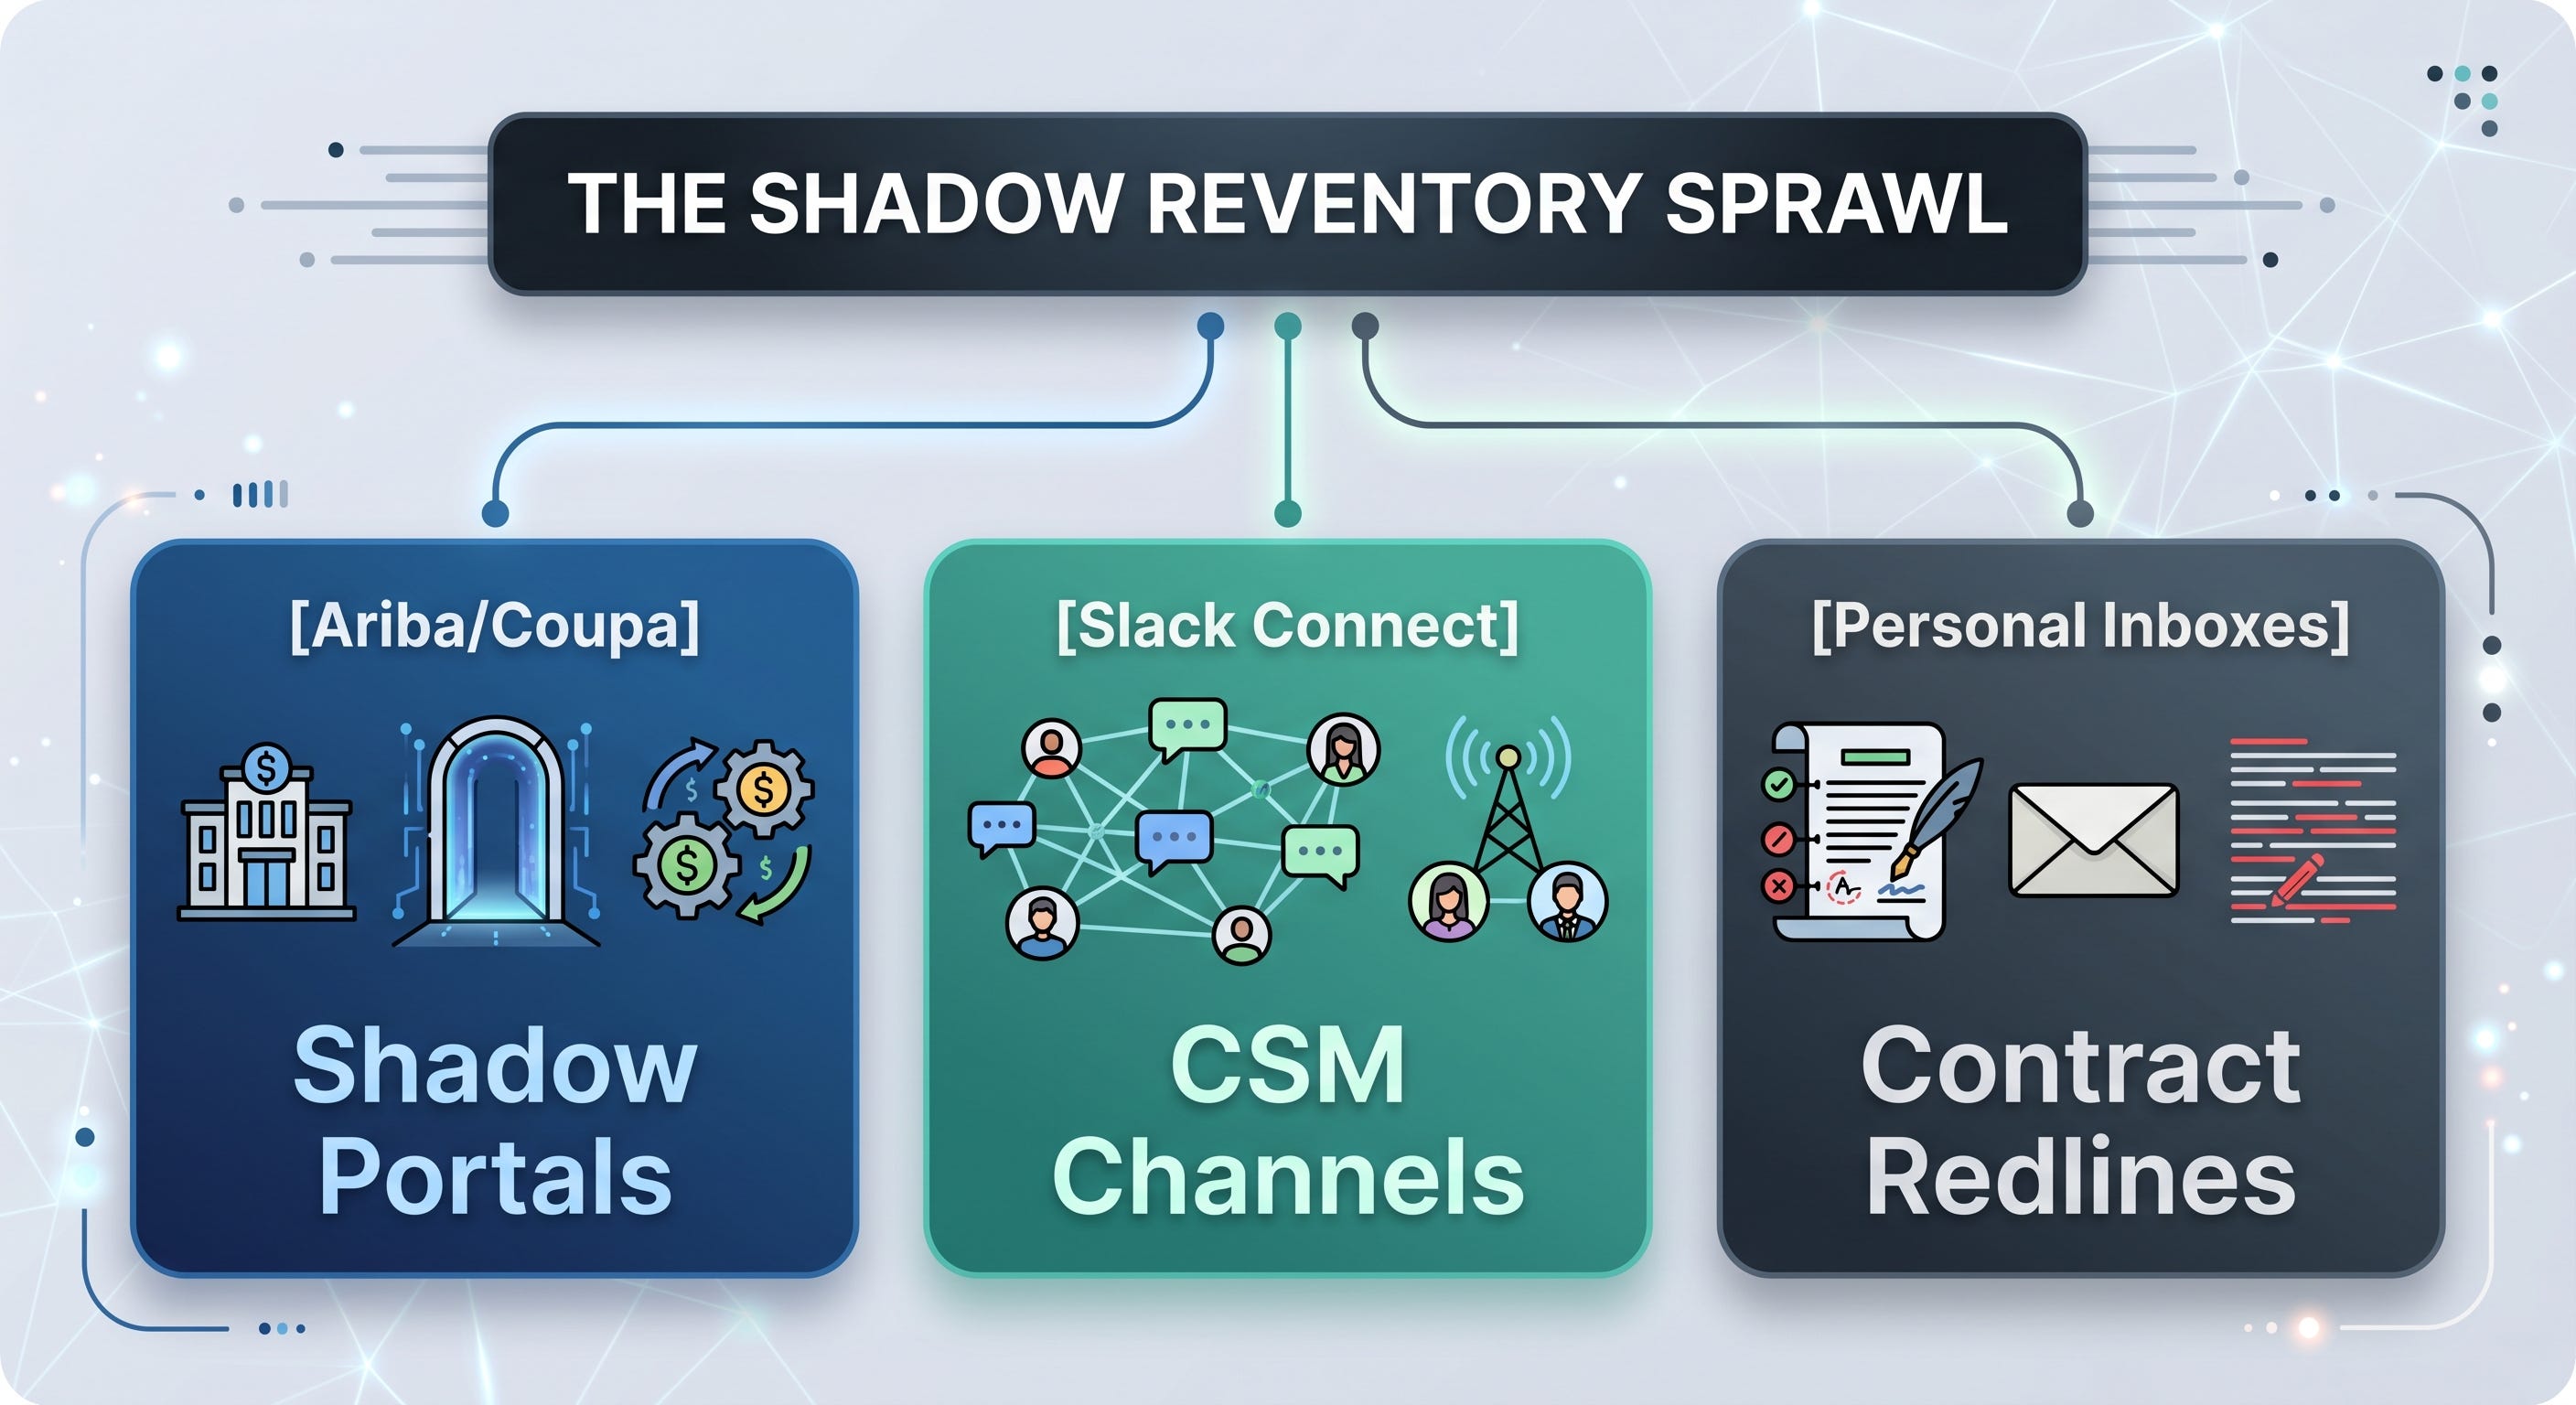
Reps routinely conduct negotiations in shared Slack Connect channels, personal email accounts, WhatsApp threads, and client-side procurement networks like SAP Ariba or Coupa. Because manual RevOps system-mapping exercises suffer from a rapid 60-to-90-day decay cycle, senior leaders operate as Ghost Auditors. They spend up to 40% of their active calendars hand-stitching transaction records together using nothing but spreadsheet formulas and intuition.
When a critical system goes unmapped, disasters occur. In one documented benchmark case, a multi-million dollar transaction forecasted as “Commit” based on a rep’s verbal assurance stalled for three weeks because the official customer approval notification was sitting unread inside an unmapped buyer-side web portal. The technology team was tracking standard communication streams; the actual revenue signal was completely invisible.
Takeaway 7: The Bilateral Procurement Value-Exchange Protocol
The absolute greatest point of failure when trying to construct an automated revenue ledger is the Procurement Firewall. Enterprises routinely find that client procurement portals are closed, unauthenticated extranets that actively block external data crawling or script-based ingestion.
To pierce this barrier, you have to run a Demand Inversion. Stop treating the client’s procurement department as an adversarial gatekeeper and start treating them as a transaction partner.
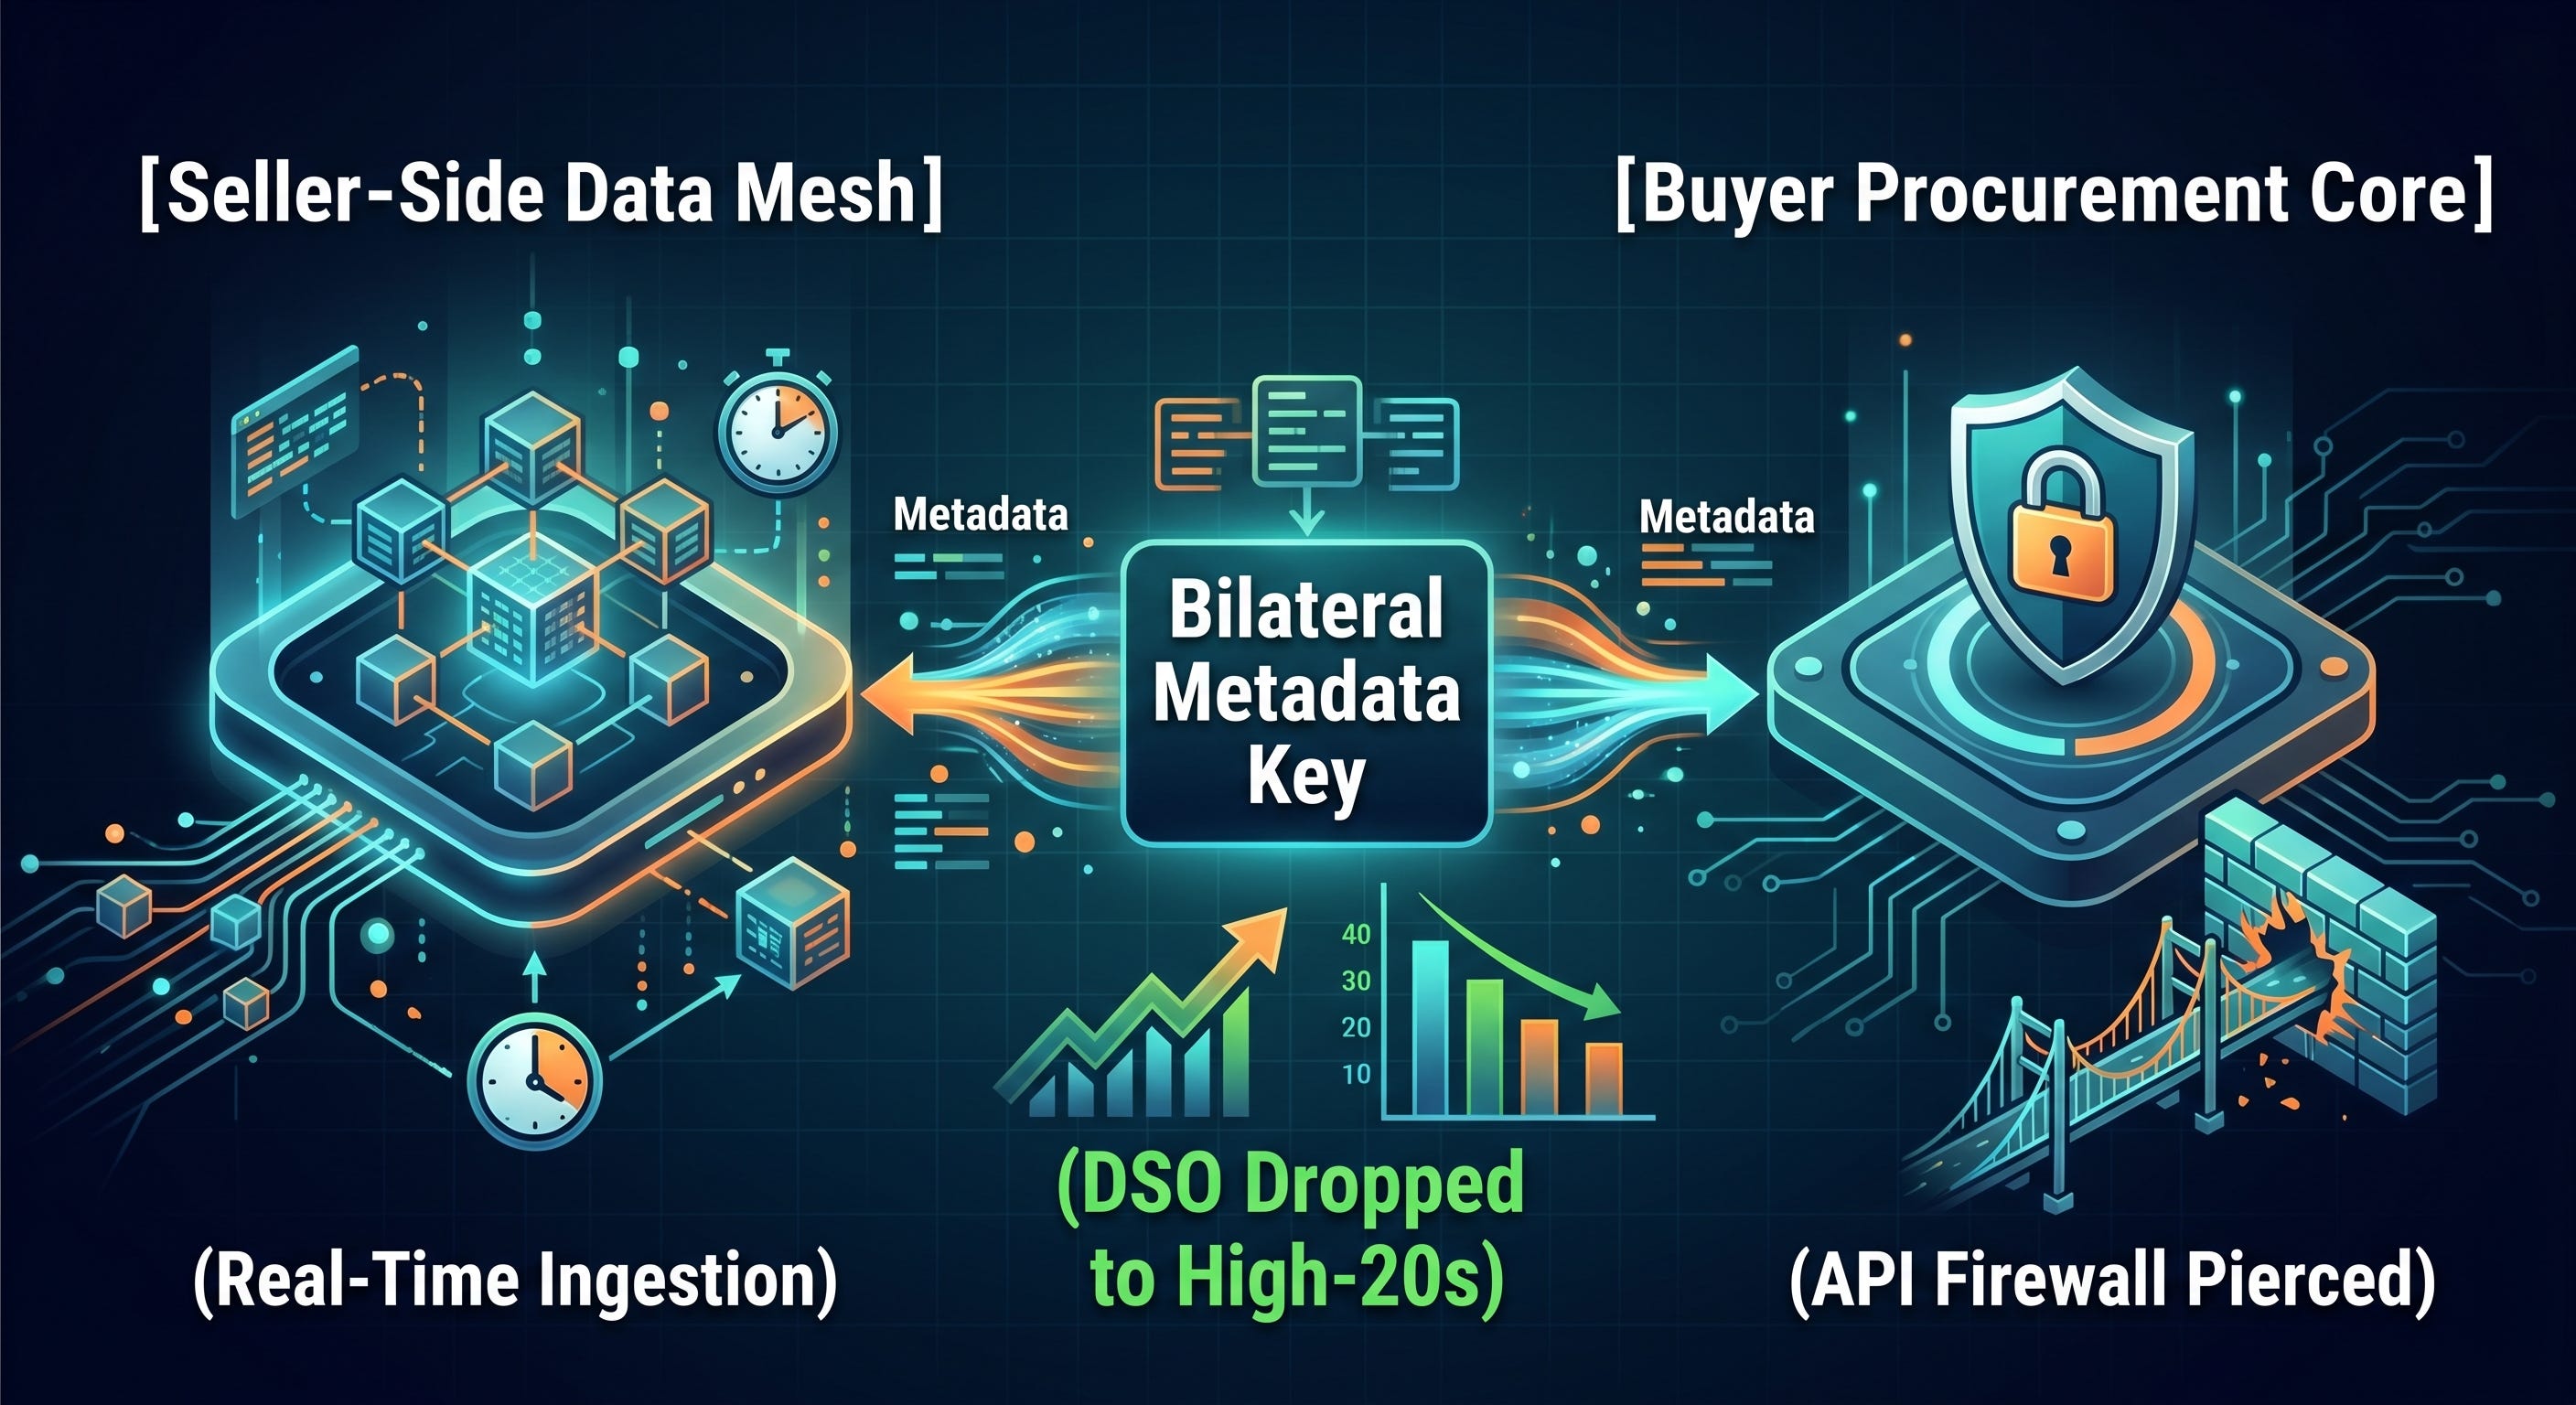
By deploying a Bilateral Procurement Value-Exchange Protocol, the selling organization offers the buy-side CFO and General Counsel access to an interactive Seller Readiness and Faster-to-Paid reconciliation dashboard. This view hands the buyer absolute visibility into fulfillment schedules, compliance tokens, and contract tracking.
In exchange for this operational efficiency, the buyer’s financial team issues a metadata-only API clearance token. This structural handshake turns a grueling, four-month legal security stall into a lightning-fast data bridge. The client’s excess internal compute infrastructure is transformed into a node that feeds your forecasting ledger with objective truth.
Takeaway 8: The Moat is the Cryptographic Chain, Not the Dashboard
If you build your entire competitive advantage around slick user interfaces, advanced machine learning scoring weights, or out-of-the-box system connectors, your business strategy has an expiration date. Incumbents like Salesforce Agentforce, Clari, or Gong have massive engineering budgets; they can clone an analytics dashboard or an API connector within a standard product release cycle.
True, un-rippable market defensibility requires constructing an immutable Lattice Provenance ledger directly at the data layer.
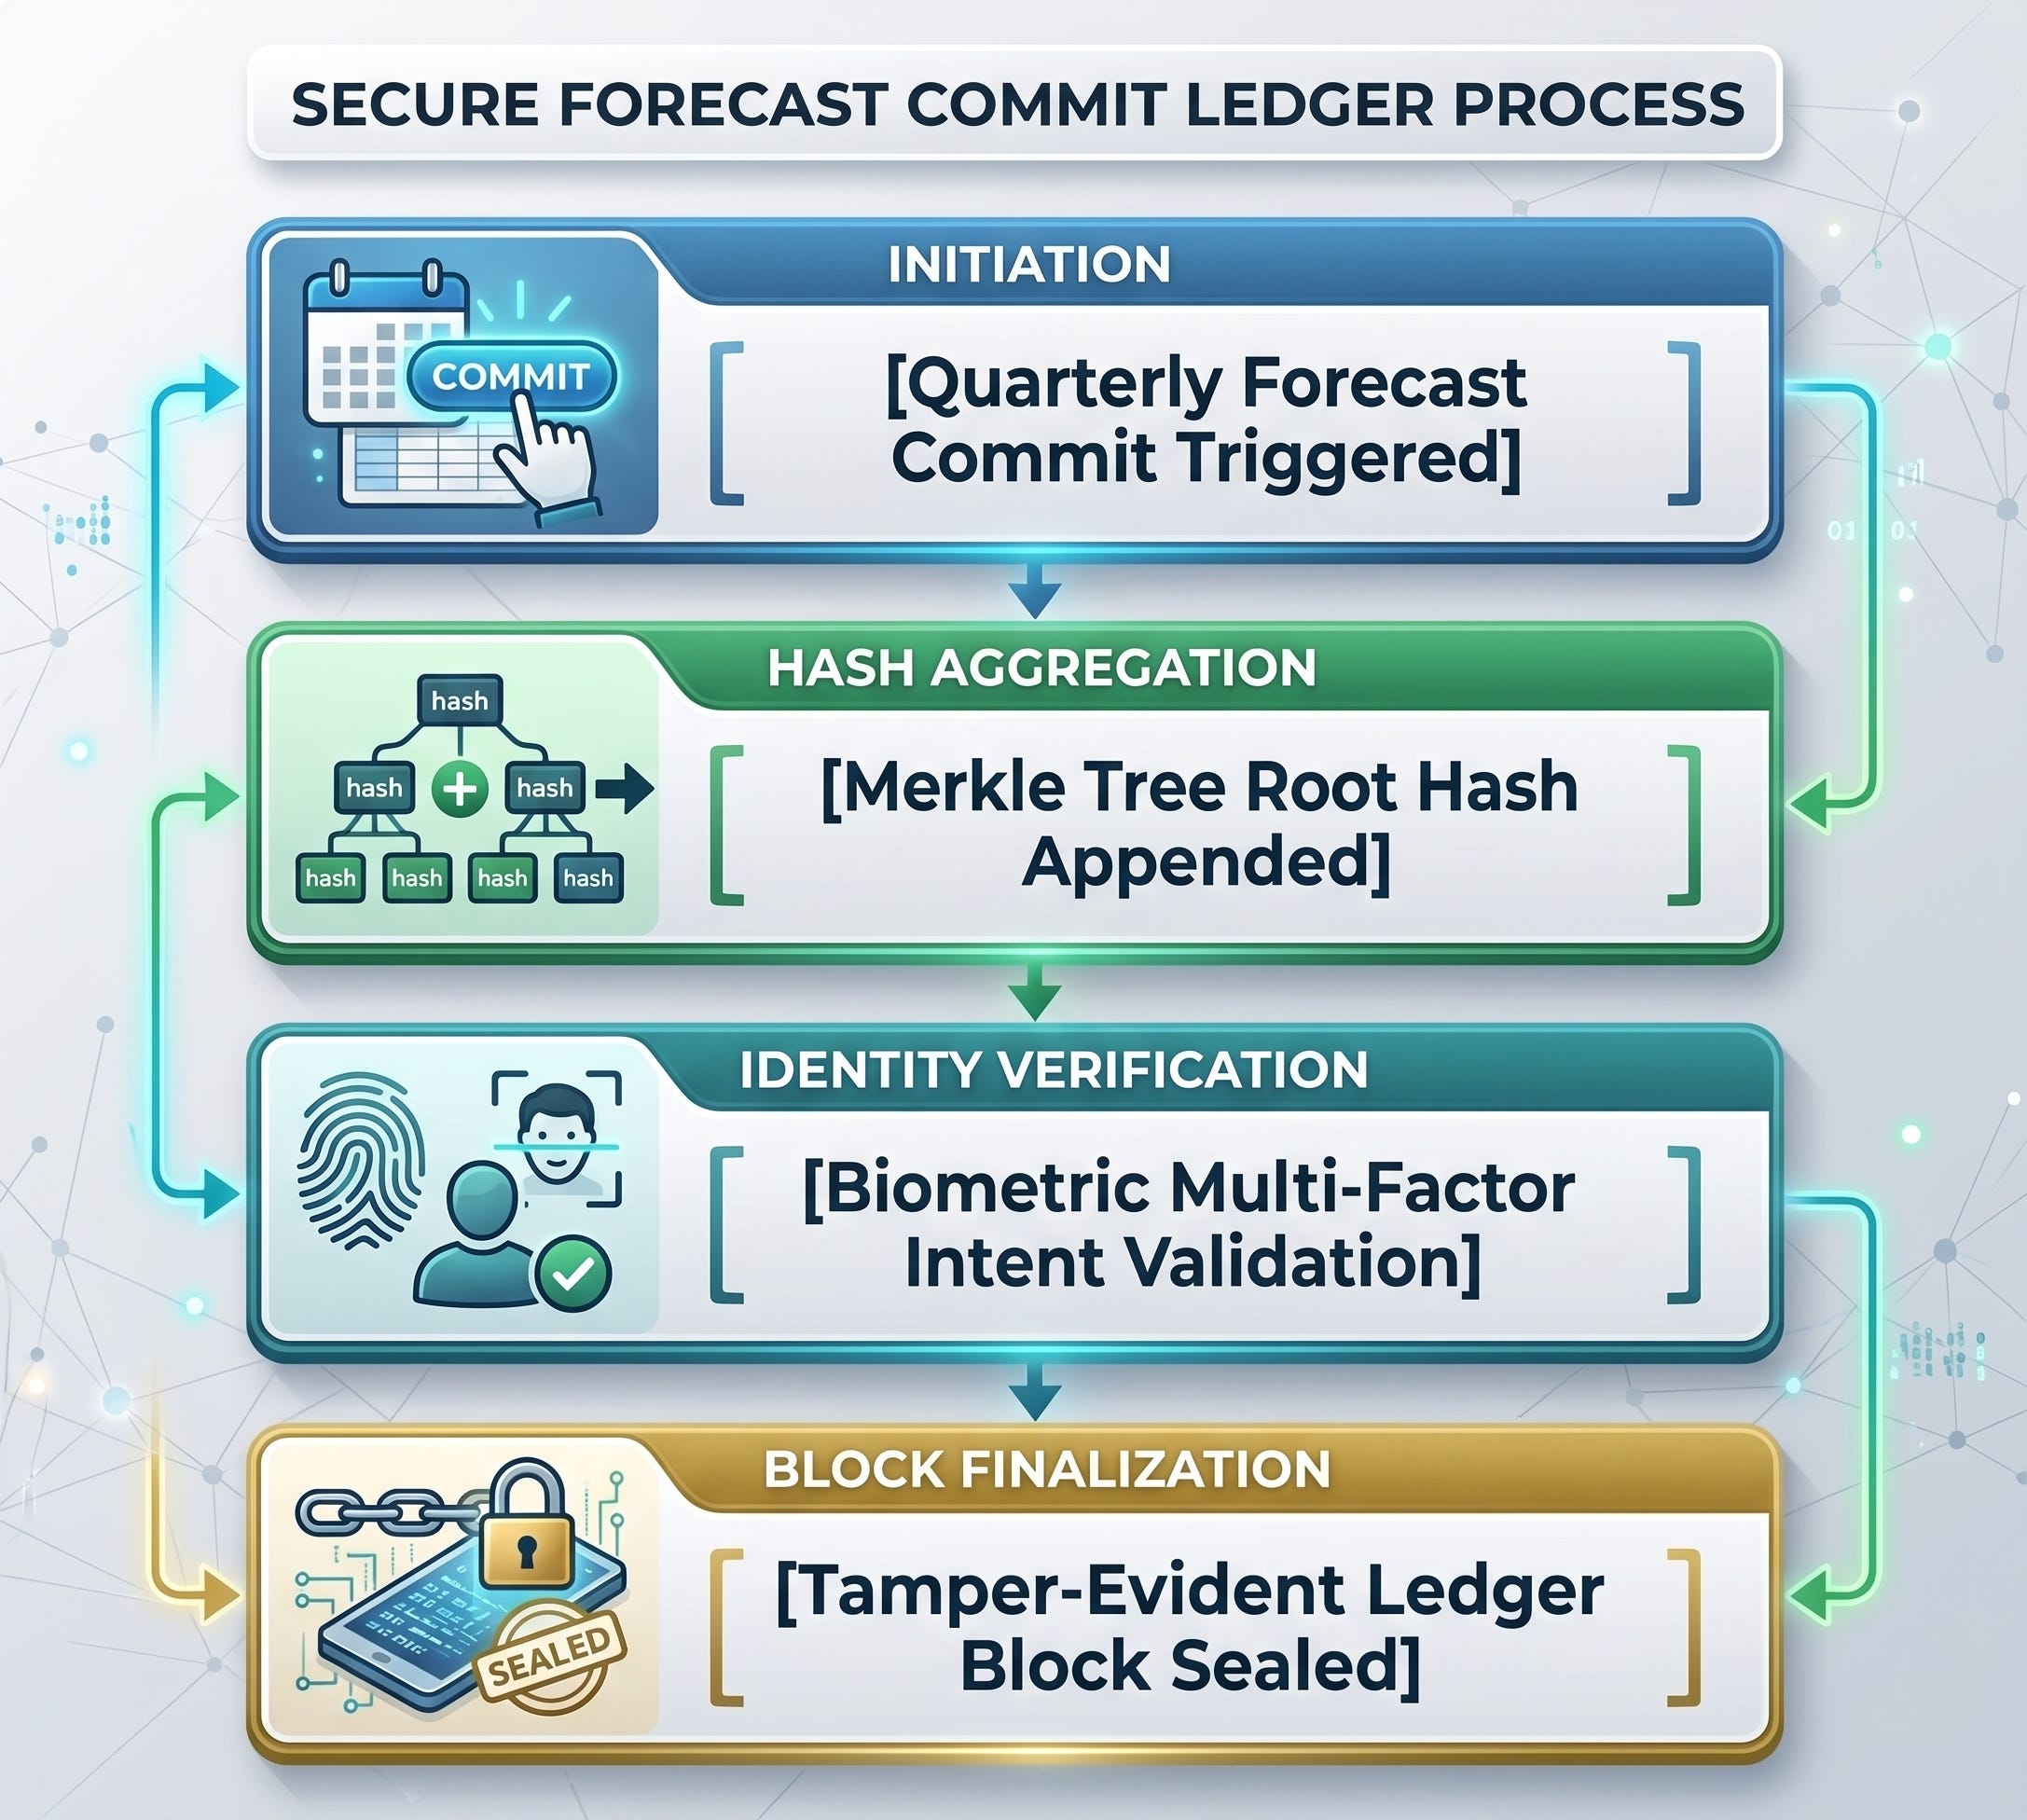
When every single forecast commit is cryptographically tied to a multi-factor biometric intent score—measuring read-time duration cursor tracking and auth-header entropy across unstructured data streams—you build a data flywheel that cannot be back-engineered.
Once an organization logs multiple fiscal quarters of transaction data onto an append-only, Merkle-tree-backed ledger, that repository transforms into an irreplaceable corporate asset. When an external auditor, an M&A diligence team, or a credit refinancing committee demands proof of revenue health, the organization doesn’t assemble a manual slide deck or point to a predictive line graph. They hand over a Tamper-Evident Evidence Package.
A competitor arriving eighteen months later can mimic your visual software style, but they can never replicate your historical provenance trail. Your platform ceases to function as an operational tool and starts functioning as the absolute gold standard for corporate financial truth.
The Strategic Path Forward
To transition your revenue operation from a system of employee testimony to a rigorous architecture of objective evidence, your execution must be sequenced across a definitive path:
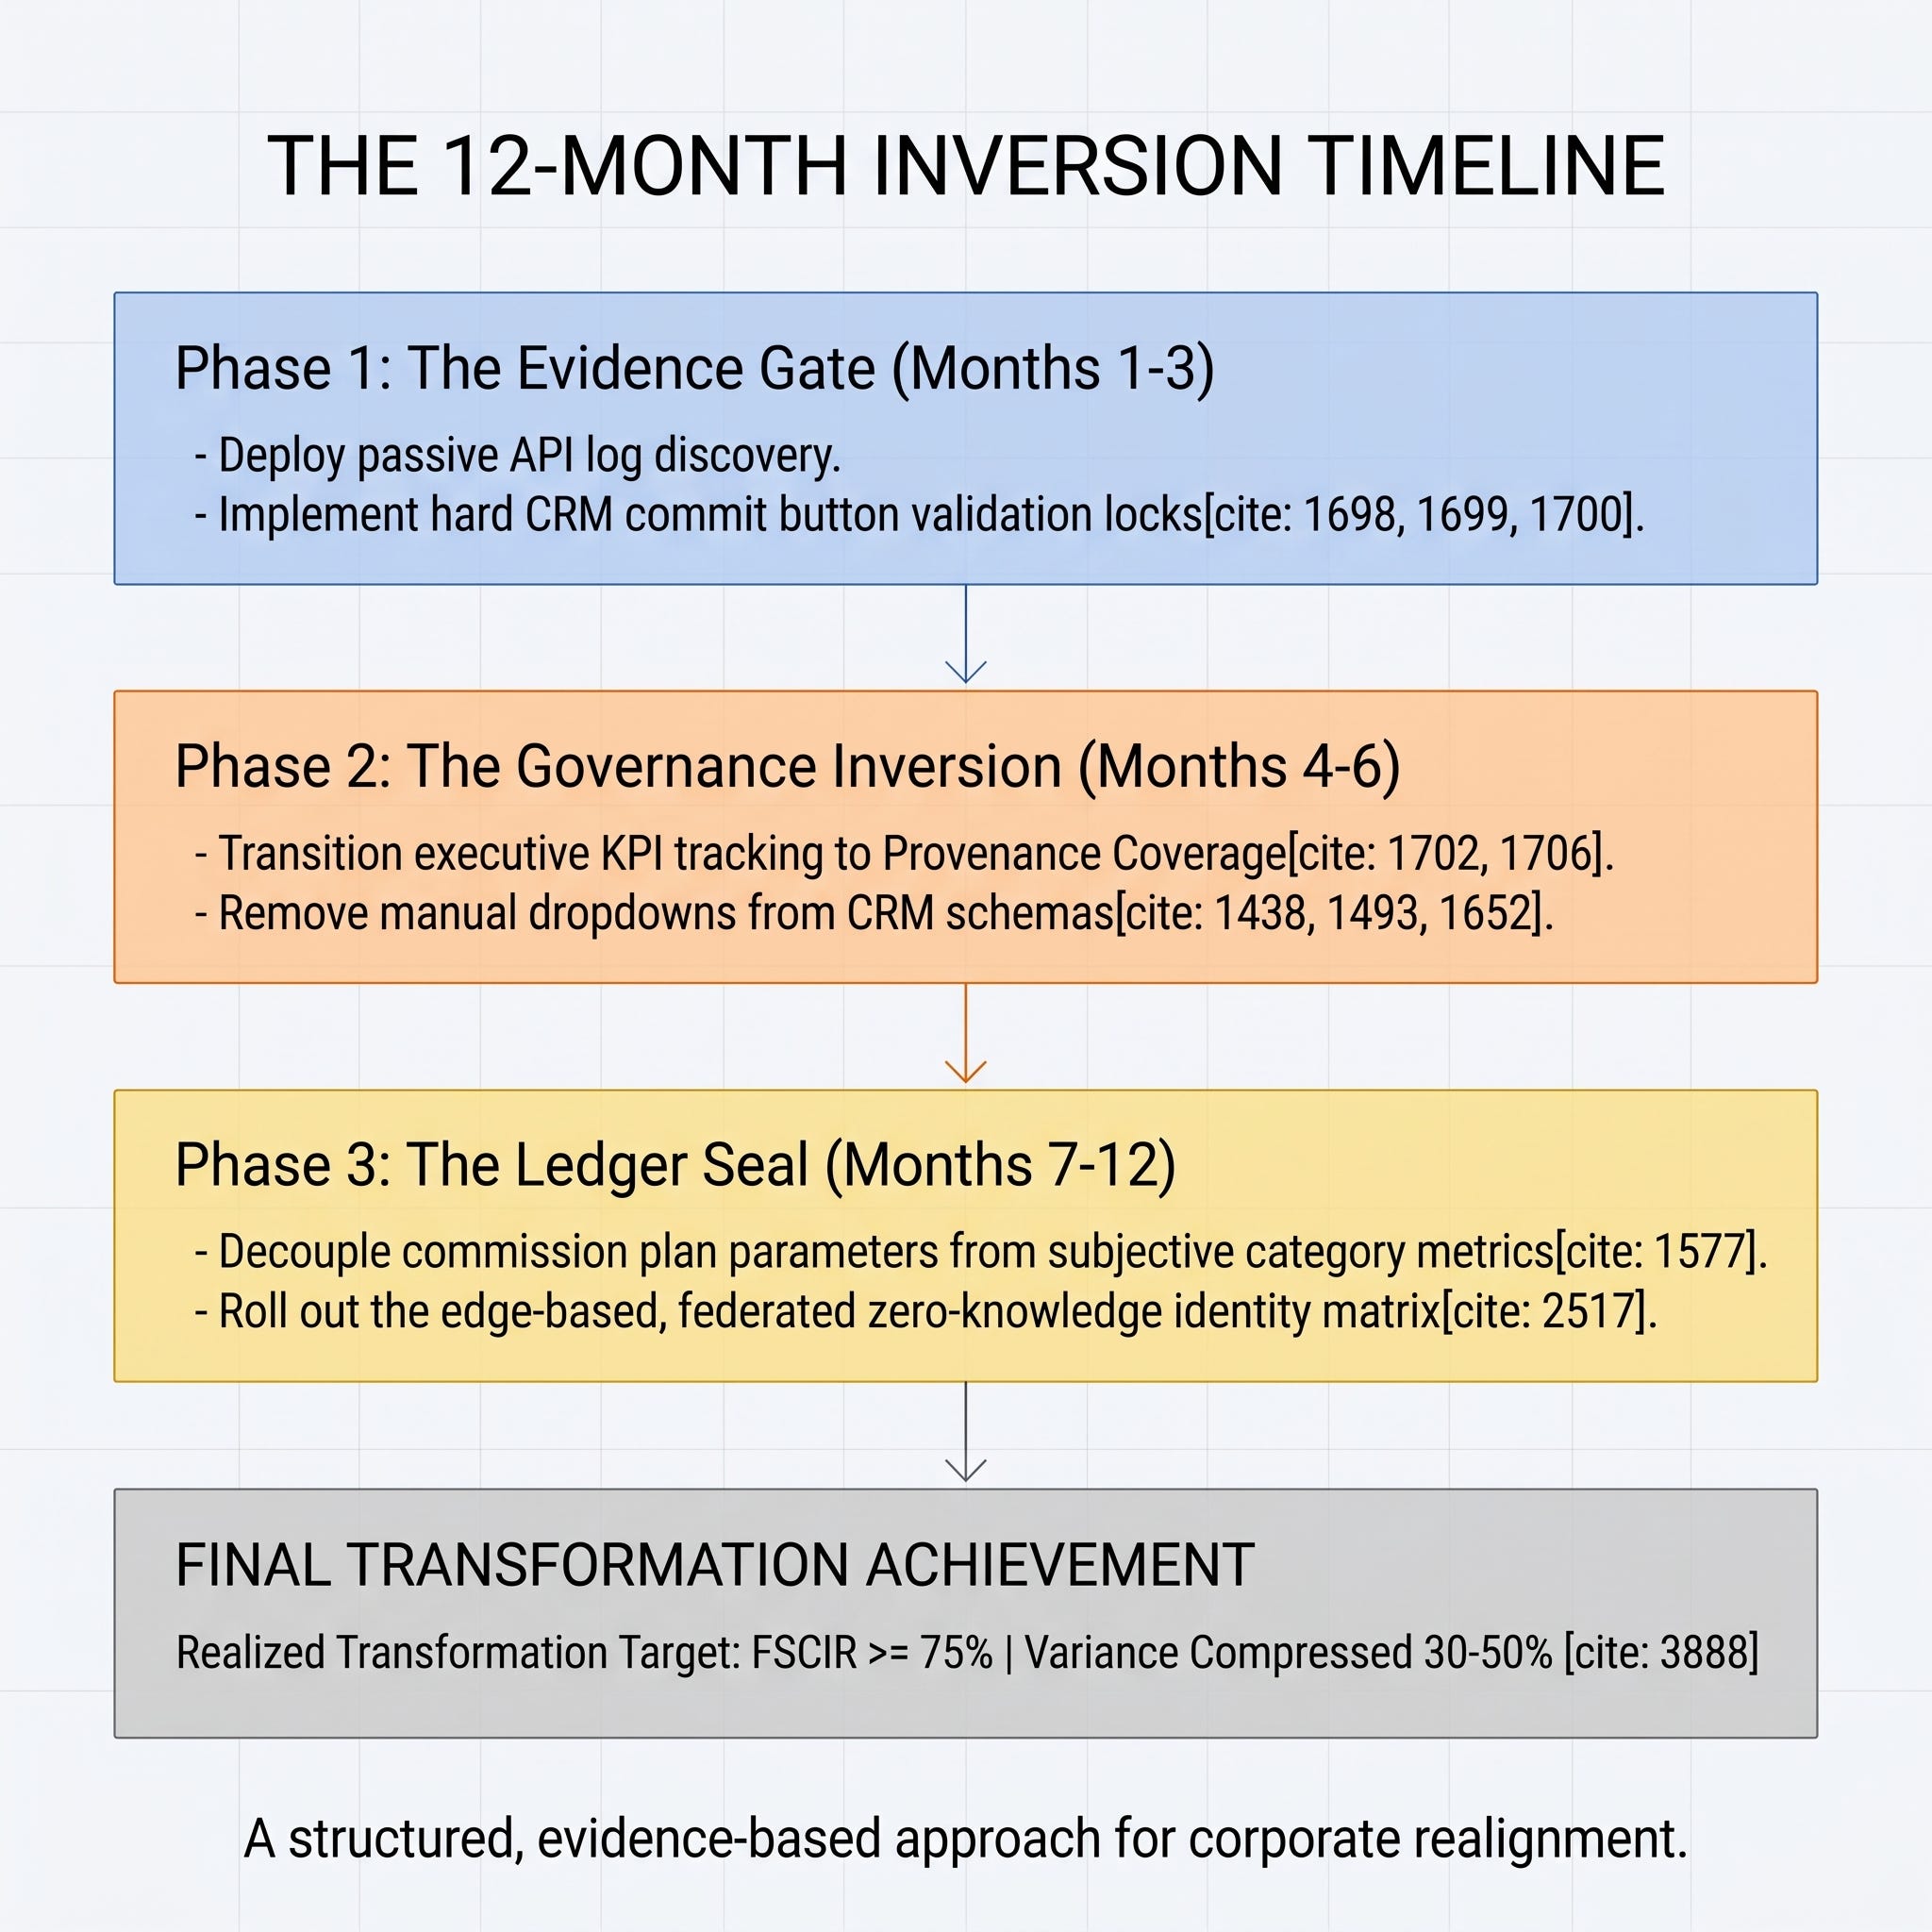
The next quarter will close exactly like the last one: your operations team will burn hundreds of hours cleaning up spreadsheet data, your reps will manipulate deal categories to clear personal commission cutoffs, and your final revenue metrics will carry a massive margin of error.
The math of corporate inefficiency is clear. You can continue to pay the manual Rep Narrative Tax every single week, or you can choose to build an architecture that forces honesty at the source.
To explore the detailed calculations behind the First-Principles Inefficiency Index, run custom data schema simulations, or run diagnostic scripts against your target revenue tech stack, click the link below to access my comprehensive, interactive workspace.
👉Access the Deeper Analysis Model & Live NotebookLM Oracle Here
Please note: The system (and platform) require that several validation gates be used in order to justify the next stage. I bypassed those for this example. My client work requires a more rigorous and tightly scoped problem statement and goes beyond basic OSINT research.
Is your organization interested in true innovation? Or does it prefer to just look busy and hire consultants? The world is changing quickly. If you’re not adapting to it, you’re not innovating. I work with organizations who are serious about attacking problems and who are tired of defending the current paradigm. Is that you? (my availability is limited).
Submit a problem or challenge: Click here
Book an appointment: Click here
Email me: mike@pjtbd.com
Call me: +1 678-824-2789
Join the community: Click here
Follow me on 𝕏: https://x.com/mikeboysen
Articles - jtbd.one - De-Risk Your Next Big Idea
Always attack…Never defend
