


You should read to the end. There is a special link to the research backing this up. First Principles, Job Maps, Moats. Oracle. No email required. 👇
Heck, for those that can’t wait, here’s the link
The Handoff Paradox: Why the Most Expensive Moment in Business is the Second a Meeting Ends
What’s the most expensive moment in a modern business enterprise? It isn’t the high-stakes executive alignment retreat or the multi-million-dollar technology implementation cycle. It’s the exact second a collaborative meeting ends.
Picture this: your cross-functional team has just concluded a grueling, chaotic, and brilliant three-hour strategy session. The energy is electric, the infinite digital canvas is covered in hundreds of color-coded sticky notes, complex dependency arrows, and neat structural layouts. Your team high-fives and logs off the call. Then, a cold dark reality sets in for some poor product manager or business analyst who has to sit down and manually transcribe all that spatial, non-linear strategic alignment into flat, linear rows in a tracking tool like Jira or Asana.
This moment is where the illusion of productivity goes to die. It represents an unsustainable “translation tax”—a hidden manual bridge layer that completely obscures operational efficiency. Every time a team must manually re-key visual spatial insight into an execution interface, it strips engineering capacity and halts momentum.
“The Zoom call drops, the room clears out, and this cold, dark operational reality just sets in... Because some poor, unfortunate product manager or business analyst has to sit down and manually— Translate all of that spatial, three-dimensional genius into a flat, boring, linear project management system.”
This handoff paradox is an absolute blind spot for corporate leadership. Because this friction doesn’t appear as a software subscription line item, traditional SaaS financial systems completely obscure the bleed. Instead, it hides within invisible labor categories, extended product development timelines, and thousands of hours of highly compensated human middleware performing lossy data conversion.
The 1,332x Inefficiency Index: How Human Middleware Inflates the Physics Floor of Data Entry
What is the true economic cost of manual data reconciliation? When quantified from a first-principles perspective, a single visual-to-linear format translation cycle costs an enterprise an astronomical $3,330.50.
This figure is built on an exhaustive breakdown of corporate labor allocation. Data gathering, intake, and quality assurance consume $2,393 per handoff, while final executive sign-off and review add another $863. When scaled across a standard benchmark of 156 enterprise customer accounts conducting approximately 3.74 million collaborative sessions annually, this operational inefficiency hemorrhages a staggering $12.46 billion in direct annual operating expenditure.
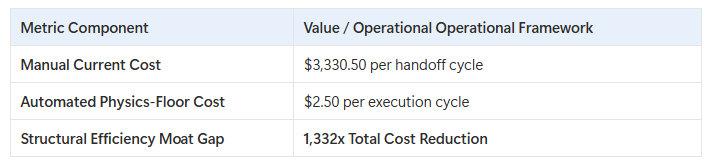
By deploying a Native Structured Spatial Semantics Protocol via Model Context Protocol (MCP) interfaces, the cost per execution cycle drops to a physics-floor benchmark of exactly $2.50. This represents a mind-boggling 1,332x cost structure reduction.
“This shifts visual assets into machine-readable format at creation, collapsing the cost per execution cycle from $3,330.50 to a physics-floor cost of $2.50 —a 1,332x reduction.”
The reflection here is profound: modern companies are running high-performance artificial intelligence models that can write code in ten seconds, yet they are forcing their most valuable engineering and product talent to act as manual, human data-routing cables. It highlights a massive asymmetry in tech architecture where upstream creative space is fundamentally decoupled from downstream autonomous velocity.
Nuance Collapse: Why AI Agents Are Entirely Blind to Your Whiteboard’s Genius
Why can’t automated connectors bridge the gap between digital canvases and execution queues? The issue is not a software engineering limitation; it is an absolute information theory entropy gap.
When human beings brainstorm on an infinite canvas, they encode logic non-linearly. They utilize visual proximity to imply conceptual affinity, vertical stack positioning to define priority, containment boundaries to denote compliance gates, and vector lines to establish causal dependency networks. However, when traditional point-solution APIs export this data, they perform a flat format serialization. They strip the coordinate systems, flatten the layout, and dump out a linear text string.
This triggers a phenomenon known as “nuance collapse”. The text content of individual sticky notes survives, but the topological relational framework is completely obliterated. Downstream AI systems operate on relational predicate logic, meaning they receive a context-impoverished artifact. The AI agent can read the text but is utterly blind to why element A sat adjacent to element B.
“The agent reads the text content of individual sticky notes but is blind to the topology of the board. It cannot determine why element A was positioned next to element B, or that a frame boundary indicated a security compliance gate. The entropy gap is absolute...”
This explains why basic digital copilot overlays fail to provide enterprise value. They act as basic summaries of static assets rather than active coordination surfaces. Without a protocol that maps spatial relationships as first-class cryptographic data entities at the point of creation, the visual layout remains a text-flattened cognitive silo.
The Jevons Paradox Trap: Why Incremental Optimization is a Mathematical Nightmare
Why can’t organizations simply optimize their way out of this translation tax? The answer lies in a brutal economic phenomenon called the Jevons Paradox, working at a calculated market elasticity coefficient of 1.5.
In economic theory, the Jevons Paradox states that an increase in efficiency in resource use will generate an exponential expansion in the consumption volume of that resource. When applied to enterprise data orchestration, the mathematical formula is defined as
If an IT leadership team deploys a minor automation hack that reduces the cost or time of a canvas translation cycle by 20%, the utilization volume of that workflow expands by 30%.
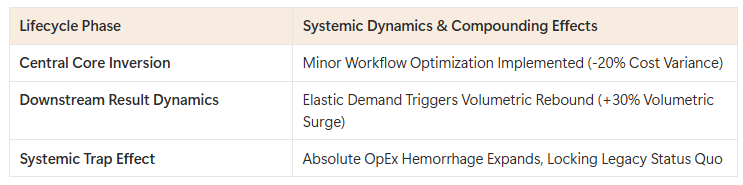
Because volume growth outpaces efficiency gains, incremental optimization acts as a mathematical trap. It locks the enterprise into a permanent cost floor set by human labor rates. Instead of banking cost savings, the organization merely expands the surface area of the data-entry problem, compounding the absolute budget hemorrhage.
“At E = 1.5, optimization compounds the problem. Efficiency gains get consumed by volume growth. The $12.46 billion annual translation tax grows, not shrinks, with incremental improvement.”
True digital transformation requires a structural inversion rather than a minor optimization. Left unchecked, traditional hub-and-spoke translation architectures trigger a “senior reviewer bottleneck,” where automated tools flood downstream tracking systems with thousands of unstructured tickets, forcing highly compensated domain experts to manually triage and clear the data surge.
The 22% Abandonment Epidemic: The Silent Death of Stranded Enterprise Pipeline
What happens when the latency between creative ideation and structured execution becomes unmanageable? The human brain breaks, teams suffer from cognitive fatigue, and the strategy is quietly abandoned.
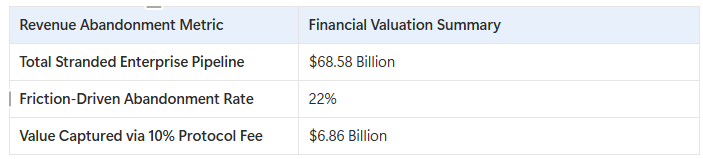
The friction of manual data translation causes a massive 22% process abandonment rate. This structural leak strands a jaw-dropping $68.58 billion in annual transaction pipeline and relationship value across the modeled ecosystem. Ideas that are celebrated as industry-shifting masterpieces during a Monday workshop are left to sit stagnant on unmonitored canvases. Within 90 days of session completion, over 30% of completed collaboration boards become completely dead intellectual property.
This represents an immense destruction of capital. When teams face five to seven discrete system transitions—taking screenshots, dropping them into corporate wikis, re-typing bullet points, and manual text tagging—the cognitive debt causes a quiet loss of confidence.
“A 22% abandonment rate means $68.58 billion in transaction volume or relationship value evaporates because teams can’t bridge the gap between creative ideation and structured execution fast enough... Deal velocity slows, relationships decay, and initiatives stall.”
This metric fundamentally re-frames the business case for platform modernization. This is not an efficiency conversation about saving a few analyst hours; it is a direct top-line revenue conversation. By moving to an agentic-native canvas architecture, an organization can prevent cross-functional insights from evaporating, capturing millions of dollars in previously stranded productivity.
The Garage Disconnect: Discovering the 200% Shadow IT Explosion
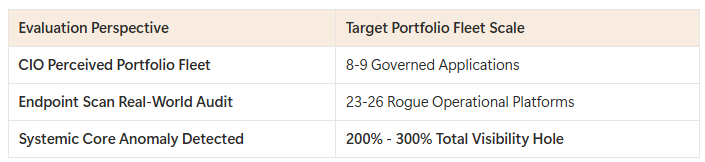
How well do enterprise technology leaders actually understand their collaboration environment? Network endpoint scans reveal a staggering disconnect between perceived tool compliance and true infrastructure reality.
In deep-dive interview audits, enterprise Chief Information Officers consistently state that they maintain a highly governed software architecture with “maybe eight or nine visual collaboration tools in active use”. However, when continuous background crawlers analyze active identity provider logs and proxy network traffic, they routinely uncover a 200% to 300% discrepancy. Large organizations frequently host between 23 and 37 entirely active, unmanaged visual point solutions simultaneously.
This shadow IT sprawl occurs because teams hit immediate friction points with mandated platforms, such as licensing bottlenecks or feature gaps, and bypass procurement entirely to get their jobs done. Even more terrifying are the undocumented “shadow integrations” built to link these rogue apps to downstream databases. Audits uncovered data analysts running custom Python scraping scripts via undocumented API calls to fuel critical financial planning sheets for eleven months straight without IT knowledge.
“So if I’m the CIO, I think I’m managing a neat little fleet of three authorized company cars, but when I actually open the garage, I find twenty-six different vehicles, half of them hot-wired. By my own employees... You don’t know the cargo, and the cargo is your most valuable corporate asset.”
The strategic implication here is a massive security and data governance exposure risk. These hidden, unapproved canvases contain the enterprise’s most sensitive intellectual property—M&A strategy frameworks, cloud vulnerabilities, and unreleased product roadmaps. When an employee leaves or a personal API key expires, undocumented pipelines break silently, leading to catastrophic corporate incident remediation loops.
The Surveillance Trap: Why the Toughest Bottleneck is a Cultural Commitment Score of 0.0
What happens when an architecture team builds an incredibly advanced technological platform but the human workforce refuses to use it? You hit the wall of cultural inertia, resulting in a validation commitment score of exactly 0.0.
During extensive strategy testing and customer interviews, researchers discovered that while technology teams are enthusiastic about AI integration, creative and user experience (UX) design cohorts present severe cultural resistance. Because these teams view the visual canvas as a sacred, psychological safety surface for messy and unformed thought, the introduction of automated background agents triggers intense anxiety. Designers routinely characterize agentic canvas monitoring with a single chilling word: “surveillance”.
“Our design team, our UX folks... there’s real resistance there. They feel like if AI starts reading their whiteboards... they use the word ‘surveillance.’ They feel surveilled. Like someone’s looking over their shoulder.”
This cultural friction is a primary reason why enterprise transformation initiatives stall out or get rejected by finance. If an enterprise deployment forces a rigid structured layer that replaces freeform visual expression, the workforce will actively subvert the tool.
To break this gridlock, change management must be embedded directly into the technical architecture. Instead of using agents as stateless auditors that summarize concepts away, platforms must deploy persistent canvas “sidekicks” that act as multi-model co-creators, enhancing and expanding human spatial reasoning rather than restricting it.
Please note: The system (and platform) require that several validation gates be used in order to justify the next stage. I bypassed those for this example. I also created an arbitrary problem statement and injected an OSINT deep research report using a special prompt. You might scope this differently. This is an example only.
The Trojan Horse Theory: Why the Future of Visual Collaboration Involves No Visuals at All
What is the ultimate destination of the collaborative digital canvas? It is not a prettier user interface or a smoother digital stylus; it is the absolute erasure of the visual surface itself.
Traditional software incumbents measure vanity metrics like monthly active users, session duration, and board volume because their legacy billing models depend entirely on selling human seats. But in a landscape dominated by autonomous multi-agent systems, the visual board shifts from a drawing app into an active enterprise AI trust infrastructure. The canvas is simply a human-friendly frontend designed to capture psychological reasoning traces.
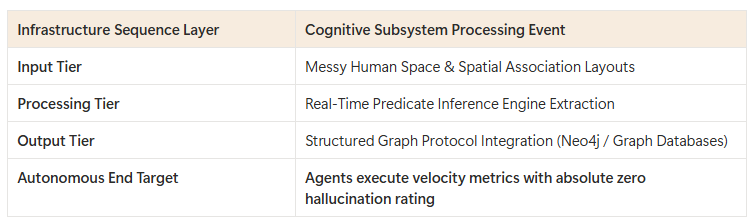
Once a centralized spatial predicate inference engine extracts real-time metadata (gestalt clusters, adjacency weights, and directional flows) into an in-memory graph database, the visual layout becomes secondary. The true product is a machine-readable semantic layer that prevents autonomous AI agents from hallucinating context when executing downstream actions.
“This isn’t a visual collaboration business. It’s an enterprise AI trust infrastructure business. The visual canvas is just the entry point where humans feel safe expressing messy, incomplete thinking... The whiteboard is the Trojan horse. The trust infrastructure is the prize.”
This architectural inversion re-defines market value. The platform that commands the structured spatial semantics standard commands the operational layer of the enterprise. It establishes a profound, un-replicable defensive moat: once an organization’s multi-agent ecosystems are trained to reason natively against rich spatial predicates, the structural switching costs become absolute.
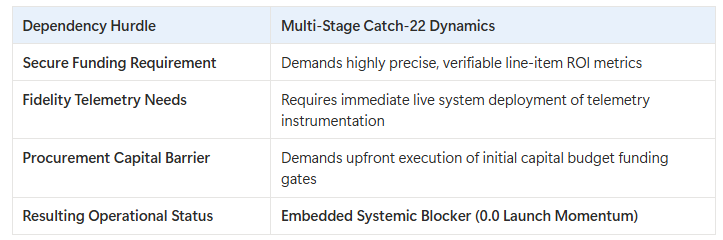
The Roadmap Forward: Breaking the Measurement Void
The fundamental bottleneck holding back enterprise transformation is a classic, architectural Catch-22: a corporate champion cannot secure a technology modernization budget without presenting line-item financial precision to the CFO, but they cannot collect that precise telemetry data without first deploying the modern platform.
To break this loop, organizations must move away from speculative procurement pitches and deploy an automated pre-flight validation protocol. Leaders can initiate a zero-code, manual concierge audit inside a single department to map ground-truth evidence, trace shadow IT applications, and establish a clear baseline Canvas-to-Execution Yield.
Are the visual collaboration tools running across your departments functioning as engines of compounding organizational value, or are they merely expensive, high-entropy cognitive silos waiting to collapse your enterprise AI roadmap?
Want to deep-dive into the raw financials, information architectures, and algorithmic models behind this transformation? Click the link below to access the deeper interactive strategic analysis bundle and activate your custom NotebookLM oracle.
Is your organization interested in true innovation? Or does it prefer to just look busy and hire consultants? The world is changing quickly. If you’re not adapting to it, you’re not innovating. I work with organizations who are serious about the subject and are willing to challenge the current paradigm. Is that you? (my availability is limited)
Book an appointment: https://pjtbd.com/book-mike
Email me: mike@pjtbd.com
Call me: +1 678-824-2789
Join the community: https://pjtbd.com/join
Follow me on 𝕏: https://x.com/mikeboysen
Articles - jtbd.one - De-Risk Your Next Big Idea
Always attack…Never defend
