
Executive Summary: The TL;DR
The traditional fee-for-service healthcare system fails vulnerable populations through massive Lean Wastes in transportation, overprocessing, and fragmented care. While bringing care into the home solves initial access friction, it creates a fatal elasticity volume threat: if localized care becomes frictionless, demand for human attention will scale infinitely, instantly crushing the finite supply of Community Health Workers and Nurse Practitioners. To survive, organizations must shift from merely optimizing human travel time to a structural inversion: deploying decentralized, continuous-monitoring platforms where AI orchestrates zero-marginal-cost preventative interventions, reserving expensive human labor exclusively for edge-case acute escalations.
Phase -1: Research Dossier & First-Principles Data Anchors
1. Market Leaders & Recent Moves
Cityblock Health: Raised over $850M; focuses heavily on Medicaid and dual-eligibles using neighborhood hubs and virtual care.
Oak Street Health: Acquired by CVS for $10.6B; relies on high-touch, value-based primary care for Medicare Advantage.
ChenMed: VIP care model for seniors; caps physician panels at ~400 patients (vs. the industry standard of 2,000+).
2. Documented Market Friction & Lean Wastes
Provider Burnout (Overprocessing Waste): PCPs spend nearly 2 hours on EHR documentation for every 1 hour of direct patient care.
Alert Fatigue (Defect Waste): Predictive models flag too many “high-risk” patients without providing targeted, actionable workflows for the care team, paralyzing the triage process.
Scaling Bottlenecks (Waiting Waste): Culturally competent roles like Doulas and Community Health Workers (CHWs) face massive attrition due to low reimbursement caps and high emotional toll.
3. The Denominator (The Physics & Statutory Floor)
Physical Floor: Travel time. In dense urban centers, a CHW or NP can physically complete a maximum of 4 to 6 in-home visits per 8-hour shift. The speed of traffic is the ultimate limit on capacity.
Statutory Floor: CMS (Centers for Medicare & Medicaid Services) compliance and HIPAA regulations mandate specific human-in-the-loop documentation for capitation and risk-adjustment factor (RAF) scoring.
4. The Numerator (Current Commercial Cost / Labor Rates)
Note: Figures represent fully loaded industry-average enterprise costs (Salary + Benefits + Overhead).
Community Health Worker (CHW) / Doula: ~$65,000/yr (~$31/hr).
Nurse Practitioner (NP) / Physician Assistant (PA): ~$140,000/yr (~$67/hr).
Primary Care Physician (PCP): ~$280,000+/yr (~$135/hr).
Emergency Room Visit (Avoidable): ~$2,200 - $3,000 per incident.
5. The Elasticity of Demand (The Volume Threat)
Elasticity Factor: 2.5 (Hyper-Elastic).
The Reality: High-needs populations suffer from profound isolation and health anxiety. If a provider offers free, frictionless, at-home human visits, patients will utilize the service for non-acute loneliness or minor ailments. The demand for “human connection” is functionally infinite, meaning the volume will immediately overwhelm the fixed supply of clinicians.
6. Industry Standard Dependencies
Transitioning a legacy MSO (Management Services Organization) to a fully capitated, downside-risk model requires 18 to 36 months of actuarial validation.
Integrating external SDoH (Social Determinants of Health) data with legacy hospital EHRs (Epic, Cerner) averages 9 to 14 months of integration timeline.
The Socratic Deconstruction of Value-Based Care
Value-based care sounds amazing in boardrooms, but it routinely crashes on the pavement of reality. We blindly assume that sending clinicians into living rooms permanently solves the access problem for vulnerable, high-need populations. It doesn’t. It just moves the waiting room to the highway and bankrupts the operating model. Let’s deconstruct the lies we tell ourselves about whole-person health.
Clarifying the “Whole Person” Assumption
The modern healthcare enterprise is obsessed with the phrase “whole-person care.” We use it as a catch-all marketing term, but structurally, the system has no idea how to execute it. Clarifying this assumption requires us to separate clinical interventions from Social Determinants of Health (SDoH). We pretend that managing a patient’s diabetes is purely a medical challenge. In reality, it is a supply-chain problem regarding refrigerated insulin and food security.
To execute true whole-person care, an organization must act as a logistical hub, not just a clinical outpost. Integrating external SDoH data—like food bank utilization or housing instability—with legacy hospital Electronic Health Records (EHRs) like Epic or Cerner averages a brutal 9 to 14 months of integration timeline. Because this data is siloed, providers are flying blind. They treat the physiological symptom (high A1C) while completely ignoring the environmental root cause (living in a food desert). Until the data infrastructure treats a missed utility payment with the same urgency as a missed cardiology appointment, “whole-person care” remains a theoretical fiction.
Challenging the In-Home Care Panacea
The most dangerous assumption in modern population health is that at-home care is the ultimate solution. We look at the friction of getting a homebound senior to a clinic and decide the answer is to reverse the commute. This is a massive structural error. Applying the Socratic Inversion, we must ask: What if bringing care into the home doesn’t solve the bottleneck, but actually creates a more expensive one?
When we deploy a Nurse Practitioner (NP) to a patient’s home, we are fighting the undisputed laws of physics. The absolute physical floor for this operational model is travel time. In dense urban centers or sprawling rural counties, an NP can physically complete a maximum of 4 to 6 in-home visits per 8-hour shift. The speed of local traffic is the ultimate limit on clinical capacity.
Financially, this is catastrophic. We are taking a highly skilled clinician costing the enterprise ~$140,000/yr (~$67/hr) and turning them into a chauffeur for 40% of their day. We have solved the patient’s transportation friction by absorbing a fatal operational friction. While market leaders like Cityblock Health and Oak Street Health have raised billions to tackle this exact demographic, relying exclusively on human-driven, analog routing guarantees that the model will buckle under the weight of population scale.
Evidence & Reasoning: The Actual Drivers of TCOC
If we want to fix the system, we have to look at the empirical data driving the Total Cost of Care (TCOC). The financial bleeding in Medicare Advantage and managed Medicaid does not come from preventative primary care visits. The catastrophic costs stem from reactive, entirely avoidable emergency room admissions. A single avoidable ER visit costs a health plan between $2,200 and $3,000 per incident.
The reasoning engine of the legacy system is fundamentally reactive. We wait for a patient with Congestive Heart Failure (CHF) to gain eight pounds of water weight over a weekend, panic, and call an ambulance. To combat this, tech-enabled MSOs deploy predictive algorithms to flag “high-risk” patients. However, this creates a massive Defect Waste known as alert fatigue. The models flag hundreds of patients without providing targeted, actionable workflows for the care team. Triage is paralyzed. When Community Health Workers (CHWs) and Doulas—costing ~$65,000/yr—are overwhelmed by false positives, they face massive attrition due to the emotional toll. The evidence proves that dumping raw risk data onto an understaffed care team actually increases operational paralysis and drives TCOC higher.
Alternative Viewpoints: The Payer vs. The Overwhelmed Caregiver
To truly deconstruct the problem, we must expand our aperture and examine the conflicting incentives of the stakeholders involved. The Payer (the health plan or government entity) views the patient through the lens of actuarial risk. Their primary objective is capturing accurate Risk-Adjustment Factor (RAF) scores to secure CMS capitation rates. Transitioning a legacy MSO to this fully capitated, downside-risk model requires 18 to 36 months of actuarial validation. The Payer optimizes for compliant coding, not necessarily human empathy.
Conversely, we must look at the true, unrecognized Job Executor in the healthcare system: the informal family caregiver. The overwhelmed daughter trying to manage her mother’s dementia doesn’t care about RAF scores or capitation mathematics. She is suffocating under the weight of administrative red tape, trying to coordinate disparate specialists, manage Medicaid transportation, and dispense complex medications.
When we build solutions, we build them for the billing department or the clinician. We completely ignore the family quarterback. If the caregiver burns out, the patient defaults to the ER, and the Payer’s actuarial math collapses. The alternative viewpoint reveals that protecting and empowering the informal caregiver is actually the most effective mechanism for controlling clinical costs.
The First Principle: Health as a Continuous Environmental State
By stripping away the symptomatic failures—the alert fatigue, the travel bottlenecks, the misaligned incentives—we hit bedrock. The foundational flaw in the legacy healthcare model is that it views health as a transactional event. You are healthy until you are not, at which point you have a “visit” to fix it.
The First Principle of population health is that health is a continuous environmental state. It is not a 15-minute appointment.
A patient’s physiological trajectory is dictated by the 99% of their life spent outside the presence of a clinician. Therefore, relying on synchronous, analog human visits to manage this continuous state is mathematically impossible. You cannot staff enough doctors to watch every patient every day. To radically alter the unit economics of vulnerable population care, we must stop trying to optimize the trip the clinician takes. We must completely reconstruct the environment the patient lives in, shifting from reactive, episodic interventions to continuous, ambient orchestration.
The Efficiency Delta & Lean Wastes Diagnosis
We are attempting to run a 21st-century predictive health enterprise on a 19th-century delivery chassis. Every time a health plan executive talks about “scaling” in-home care, they are ignoring the brutal mathematical reality of the physical world. You cannot achieve venture-scale margins or structural resilience when your primary mechanism of value delivery is stuck in rush-hour traffic. It is time to calculate exactly how fragile this system is and categorize the rot using first principles.
Calculating the ID10T Index for Fragmented Care
The ID10T (Inefficiency Delta) Index reveals exactly how structurally fragile a delivery system is to infinite scale, and in-home value-based care scores perilously close to 100 (Total Failure). We calculate this index by taking the current commercial cost of the process (The Numerator) and dividing it by the absolute theoretical minimum cost dictated by physics or law (The Denominator).
In legacy healthcare, we refuse to acknowledge the denominator. We build massive logistical apparatuses to manage fleets of cars, scheduling coordinators, and routing software. This is the equivalent of investing billions to make a horse-drawn carriage 5% more aerodynamic. The ID10T calculation proves that optimizing a structurally flawed delivery mechanism—moving a physical human to check a biological vital sign—is an exercise in futility. As long as the ID10T score remains this high, the enterprise is highly susceptible to demand shocks, provider burnout, and total margin collapse.
The Numerator: The Exorbitant Cost of Reactive ER Admissions
The financial numerator in our equation is artificially inflated by the catastrophic cost of late-stage, reactive interventions. When a community health network fails to intercept a declining patient, the system defaults to the most expensive delivery node available: the emergency room. A single avoidable ER visit costs a health plan or at-risk provider between $2,200 and $3,000 per incident.
This financial bleeding is compounded by the unit cost of the clinical labor deployed to prevent it. We are utilizing highly trained Nurse Practitioners (NPs) and Physician Assistants (PAs) whose fully loaded enterprise costs average ~$140,000/yr (~$67/hr). When an NP spends 40% of their day staring at a steering wheel instead of a patient, the effective hourly rate of actual clinical care skyrockets. The numerator is massive not because the medicine is expensive, but because the analog routing of that medicine fails to intercept the $3,000 emergency.
The Denominator: The Physical Limits of the Home Visit
The theoretical floor for in-home care is strictly dictated by the physical speed of urban traffic and geographical sprawl. You cannot code your way out of a physical traffic jam. In dense urban centers or sprawling rural counties, an NP can physically complete a maximum of 4 to 6 in-home visits per 8-hour shift.
This is the hard anchor of the denominator. Even if we deploy the most advanced AI scheduling algorithms in the world, the physical transit time between point A and point B establishes a permanent ceiling on provider capacity. Furthermore, we face a statutory floor: Centers for Medicare & Medicaid Services (CMS) compliance mandates specific human-in-the-loop documentation for Risk-Adjustment Factor (RAF) scoring. This means the clinician cannot just wave from the doorway; they are legally bound to sit, interview, and document. As long as human transit and synchronous interviewing are required, the baseline cost of value delivery will forever remain mathematically anchored to the speed limit of the highway.
Diagnosing the 11 Lean Wastes in Community Health
The analog delivery of community-based care is currently suffocating under multiple categories of the 11 Lean Wastes Framework. We must categorize these explicitly to understand why the system is buckling.
First, we face Transportation Waste. Moving an NP or a Community Health Worker (CHW) across town to ask a patient a standard set of intake questions adds zero clinical value to the patient’s health. The transit itself is pure, unadulterated waste that consumes nearly half of the operational budget.
Second, the system is crippled by Overprocessing Waste. Primary care providers currently spend an average of 2 hours on EHR documentation for every 1 hour of direct patient care. The clinician is acting as an expensive data-entry clerk, translating analog conversations into structured billing codes to satisfy payer capitation requirements.
Third, we are generating massive Defect Waste through alert fatigue. Tech-enabled Management Services Organizations (MSOs) run predictive risk models that flag hundreds of patients as “high-risk.” However, without automated, targeted workflows, this data dump forces a $65,000/yr CHW to chase ghosts. They spend hours calling patients who don’t need help, simultaneously missing the silent escalation of a patient who actually does.
The Target: Eliminating the Waste of Transportation and Overprocessing
The strategic objective is not to make transportation faster; the objective is to eliminate the necessity of transportation entirely. Applying Elon Musk’s 5-Step Engineering Philosophy, we must “try very hard to delete the part.” In this case, the part is the routine physical visit.
If we choose to merely optimize the NP’s driving route (a Pathway B sustaining move), we trigger the Elasticity of Demand trap. The demand for human connection among isolated, high-need populations is Hyper-Elastic (Factor 2.5). If we make it highly efficient for a provider to visit a home, patients will utilize the service for non-acute loneliness or minor, easily self-managed ailments. The sheer volume of demand will instantly consume the newly created capacity.
To achieve true scale and protect the mental health of our clinicians, we must delete the transit and the manual EHR entry. We must decouple the biological data collection from the physical L3 clinical visit, reserving the expensive human asset exclusively for acute escalations that require an empathetic, physical touch.
Mapping the Job-to-be-Done: The Caregiver’s Burden
We design billion-dollar healthcare platforms for the billing department and the clinician, completely ignoring the primary engine of patient survival. If we want to intercept biological decline before it hits the emergency room, we must abandon our physician-centric bias. We must rigorously map the friction experienced by the unrecognized labor force holding the entire system together.
Identifying the True Job Executor: The Informal Family Quarterback
In the context of the 17 Universal Customer Journeys, the legacy system assumes the physician owns the Utilization Journey. This is false. The physician owns a 15-minute transactional slice of the Repair Journey. The true Job Executor—the human bearing the ultimate responsibility for the continuous environmental state of the patient—is the Informal Family Quarterback.
This executor is typically an adult child or spouse. They do not possess a medical degree, yet they are tasked with managing the biological and environmental stability of a declining family member. Their Core Job is not “providing healthcare.” Their Core Job is: Maintain the physiological and environmental stability of a vulnerable family member in the home. When this executor reaches their breaking point and fails, the system defaults to 911. Therefore, protecting this specific human’s bandwidth is the most lucrative cost-containment strategy a health plan can deploy.
The 9-Step Chronological Job Map for Managing Chronic Decline
To mathematically target our intervention, we must deconstruct the Family Quarterback’s struggle into a solution-agnostic chronological Job Map.
Define: Determine the daily baseline health status and required interventions.
Locate: Find in-network specialists, community resources, and Social Determinants of Health (SDoH) support (e.g., food banks, transit).
Prepare: Organize the environment, spanning complex medication regimens to accessible transportation.
Confirm: Verify appointment coverage, Medicaid transit arrival, and caregiver shift schedules.
Execute: Administer daily biological care, facilitate specialist interactions, and enforce dietary compliance.
Monitor: Watch continuously for silent biological escalations (e.g., sudden weight gain indicating heart failure).
Modify: Adjust daily routines and dosages based on new symptoms or physician orders.
Resolve: Handle acute physiological flare-ups or administrative rejections before dialing 911.
Conclude: Transition care levels (e.g., moving from home health to a skilled nursing facility).
Customer Success Statements (CSS) for the Prepare and Execute Phases
We cannot fix “caregiver burnout” because burnout is an unmeasurable emotion. We must translate their struggle into rigorous Customer Success Statements (CSS) using strict syntax: [Direction of Improvement] + [Metric] + [Object of Control]. The deepest friction occurs in the Prepare and Execute phases.
If we pursue a Pathway B (Sustaining) strategy, our CSS metric measures human speed. We aim to:
Minimize the time it takes the Family Quarterback to Prepare the weekly medication regimen.
Minimize the logistical friction required to Execute the transportation of the patient to a physical specialist.
If we pursue a Pathway C (Disruptive) strategy, our CSS metric measures structural deletion. We aim to:
Minimize the necessity of human intervention in the Execute phase entirely by ambiently capturing biological data.
Increase the predictability of the Monitor phase without requiring synchronous human input.
The Unified Validation Engine: Scoring the Top-Box Gaps
To prioritize which CSS to solve first, we must deploy the Unified Validation Engine and reject the statistical malpractice of the legacy enterprise. We never average 1-5 Likert scale survey data; ordinal math creates a fictitious mean that distorts the distribution of human pain. We demand State 3 empirical proof using the Top-Box Formula.
We calculate the Urgency Gap (G) by isolating the percentage of the population experiencing acute, unfulfilled need. If we survey 1,000 caregivers regarding the CSS “Minimize the time required to locate and coordinate Medicaid transportation,” and 85% rate its Importance as a 4 or 5 (I = 85%), but only 15% rate their current Satisfaction as a 4 or 5 (S = 15%), our Urgency Gap is massive (G = 70). A G score over 50 indicates a structurally broken market expectation ready for disruption.
Derived Importance: What Actually Moves the Needle on Patient Outcomes
Self-reported importance is highly susceptible to inflation bias—exhausted caregivers will rate every problem as “critically important.” To bypass this, we calculate Derived Importance (r) by running a Pearson Correlation Coefficient. We correlate the caregiver’s satisfaction with a specific CSS against the ultimate systemic failure: an avoidable ER admission.
If we correlate the CSS “Minimize the necessity of human intervention to Monitor daily vitals” and find that r approaches 0.85, the data proves that solving this specific step mathematically prevents the $3,000 ER visit. Conversely, if a feature like a “patient education portal” yields an r of 0.12, it is statistically irrelevant.
By multiplying derived impact by market urgency
we strip away the marketing fluff. The data screams an undeniable truth: the root cause of biological failure is administrative and logistical suffocation. To save the patient and the health plan’s margins, we must radically alter the unit economics of the Monitor and Execute phases for the Family Quarterback.
Pathway A: Persona Expansion (Lateral Move)
Growing the business by selling the exact same product to new people feels incredibly safe. It is the classic lateral move, promising easy revenue without forcing us to fundamentally change our core operational mechanics. But scaling an inefficient, human-dependent model to new markets doesn’t multiply your margins; it multiplies your friction. Let’s look at what happens when we try to expand our current value-based care model into new ZIP codes and specialties.
Expanding the MSO Framework to Adjacent Specialties
Expanding our Management Services Organization (MSO) to include behavioral health and nephrology multiplies our total addressable market but exposes the severe limits of analog care coordination. We currently manage primary care well because we limit physician panels to roughly 400 patients (compared to the industry standard of 2,000+). However, adding complex specialties means a single high-need patient now requires coordination across three to five different clinical silos.
For the Informal Family Quarterback, this intervention primarily targets the Locate phase of their 9-step Job Map. The Customer Success Statement (CSS) driving this strategy is: Minimize the time it takes the Family Quarterback to Locate integrated specialty care. We are attempting to bring all necessary doctors under one capitated roof to save the caregiver from navigating the fragmented open market.
Unfortunately, this introduces massive coordination friction. The moment we add a nephrologist to a patient’s care team, the Nurse Practitioner (NP) must spend an additional 45 minutes synchronously briefing that specialist. Because we are still relying on human-to-human communication rather than automated data orchestration, expanding the persona simply shifts the bottleneck. We solve the caregiver’s Locate friction but instantly exacerbate the Overprocessing Waste for our internal clinicians.
Selling the Care Coordination Engine to Rural Independent Practices
Pitching our tech-enabled coordination engine to independent rural clinics looks fantastic on a sales deck but crashes violently against severe geographical and broadband constraints. Urban models rely on dense patient populations where a Community Health Worker (CHW) can drive 10 minutes between homes. In rural environments, that drive easily exceeds 60 miles between high-needs patients.
Here, the strategic intent targets the Execute phase of the caregiver’s journey. The CSS becomes: Minimize the logistical friction required to Execute specialist interventions in low-density geographies. We assume our predictive analytics software will empower rural Independent Practice Associations (IPAs) to manage downside risk.
The reality of the physical floor shatters this assumption. The physical denominator of travel time in rural areas means our $65,000/yr CHWs might complete a maximum of two visits per day. Furthermore, broadband penetration in rural Medicaid populations routinely hovers below 65%. We cannot deploy basic telehealth infrastructure if the patient cannot connect to the internet. We are attempting to sell a digital coordination engine to a demographic constrained by 19th-century infrastructure realities.
The Technical Debt of Cross-EHR Interoperability
Selling to new independent practices forces us to integrate with dozens of fragmented, legacy Electronic Health Records (EHRs), instantly paralyzing our engineering teams. We cannot manage populations at risk if we cannot see their historical data. Every new rural clinic or adjacent specialist we acquire operates on a different, siloed instance of Epic, Cerner, or eClinicalWorks.
The implementation timeline for this pathway is entirely dictated by this technical friction. Integrating external Social Determinants of Health (SDoH) data with legacy hospital EHRs averages an agonizing 9 to 14 months of integration timeline per major health system. We are not building innovative software; we are building expensive, custom API bridges just to establish a baseline of operational visibility.
This reality generates devastating Defect Waste. When patient records fail to sync across these fragile API bridges, our predictive models ingest flawed data. The algorithms subsequently flag the wrong patients, sending our overwhelmed care teams to the wrong houses. By expanding laterally without unifying the underlying data architecture, we are scaling our technical debt faster than our clinical impact.
Evaluating the Immediate CapEx Costs
This lateral expansion requires massive upfront Capital Expenditure (CapEx) to acquire independent practices and fund the actuarial validation needed for downside risk. Pathway A is not a lightweight software deployment. It is a heavy, physical real estate and human capital play. Replicating the success of urban neighborhood hubs means signing 10-year commercial leases and hiring full clinical staffs in unproven territories.
Furthermore, transitioning a newly acquired rural clinic from fee-for-service to a fully capitated, downside-risk model is financially perilous. It requires 18 to 36 months of actuarial validation before a health plan will trust the entity with a global capitation rate. During this multi-year purgatory, our enterprise must float the operational losses.
We are paying premium acquisition multiples for physical clinics while absorbing the total financial risk of their patient panels. The linear static savings generated by better coding and RAF capture will be immediately neutralized by the exorbitant CapEx required to build out the physical footprint. We are buying revenue at the expense of our balance sheet.
The Tradeoffs of Analog Scaling
The ultimate tradeoff of Pathway A is that it scales a fragile, human-dependent architecture, guaranteeing margin collapse as patient volume inevitably grows. We are attempting to outrun the math of population health by simply hiring more people and buying more clinics. This is the definition of a linear business model masquerading as a scalable tech platform.
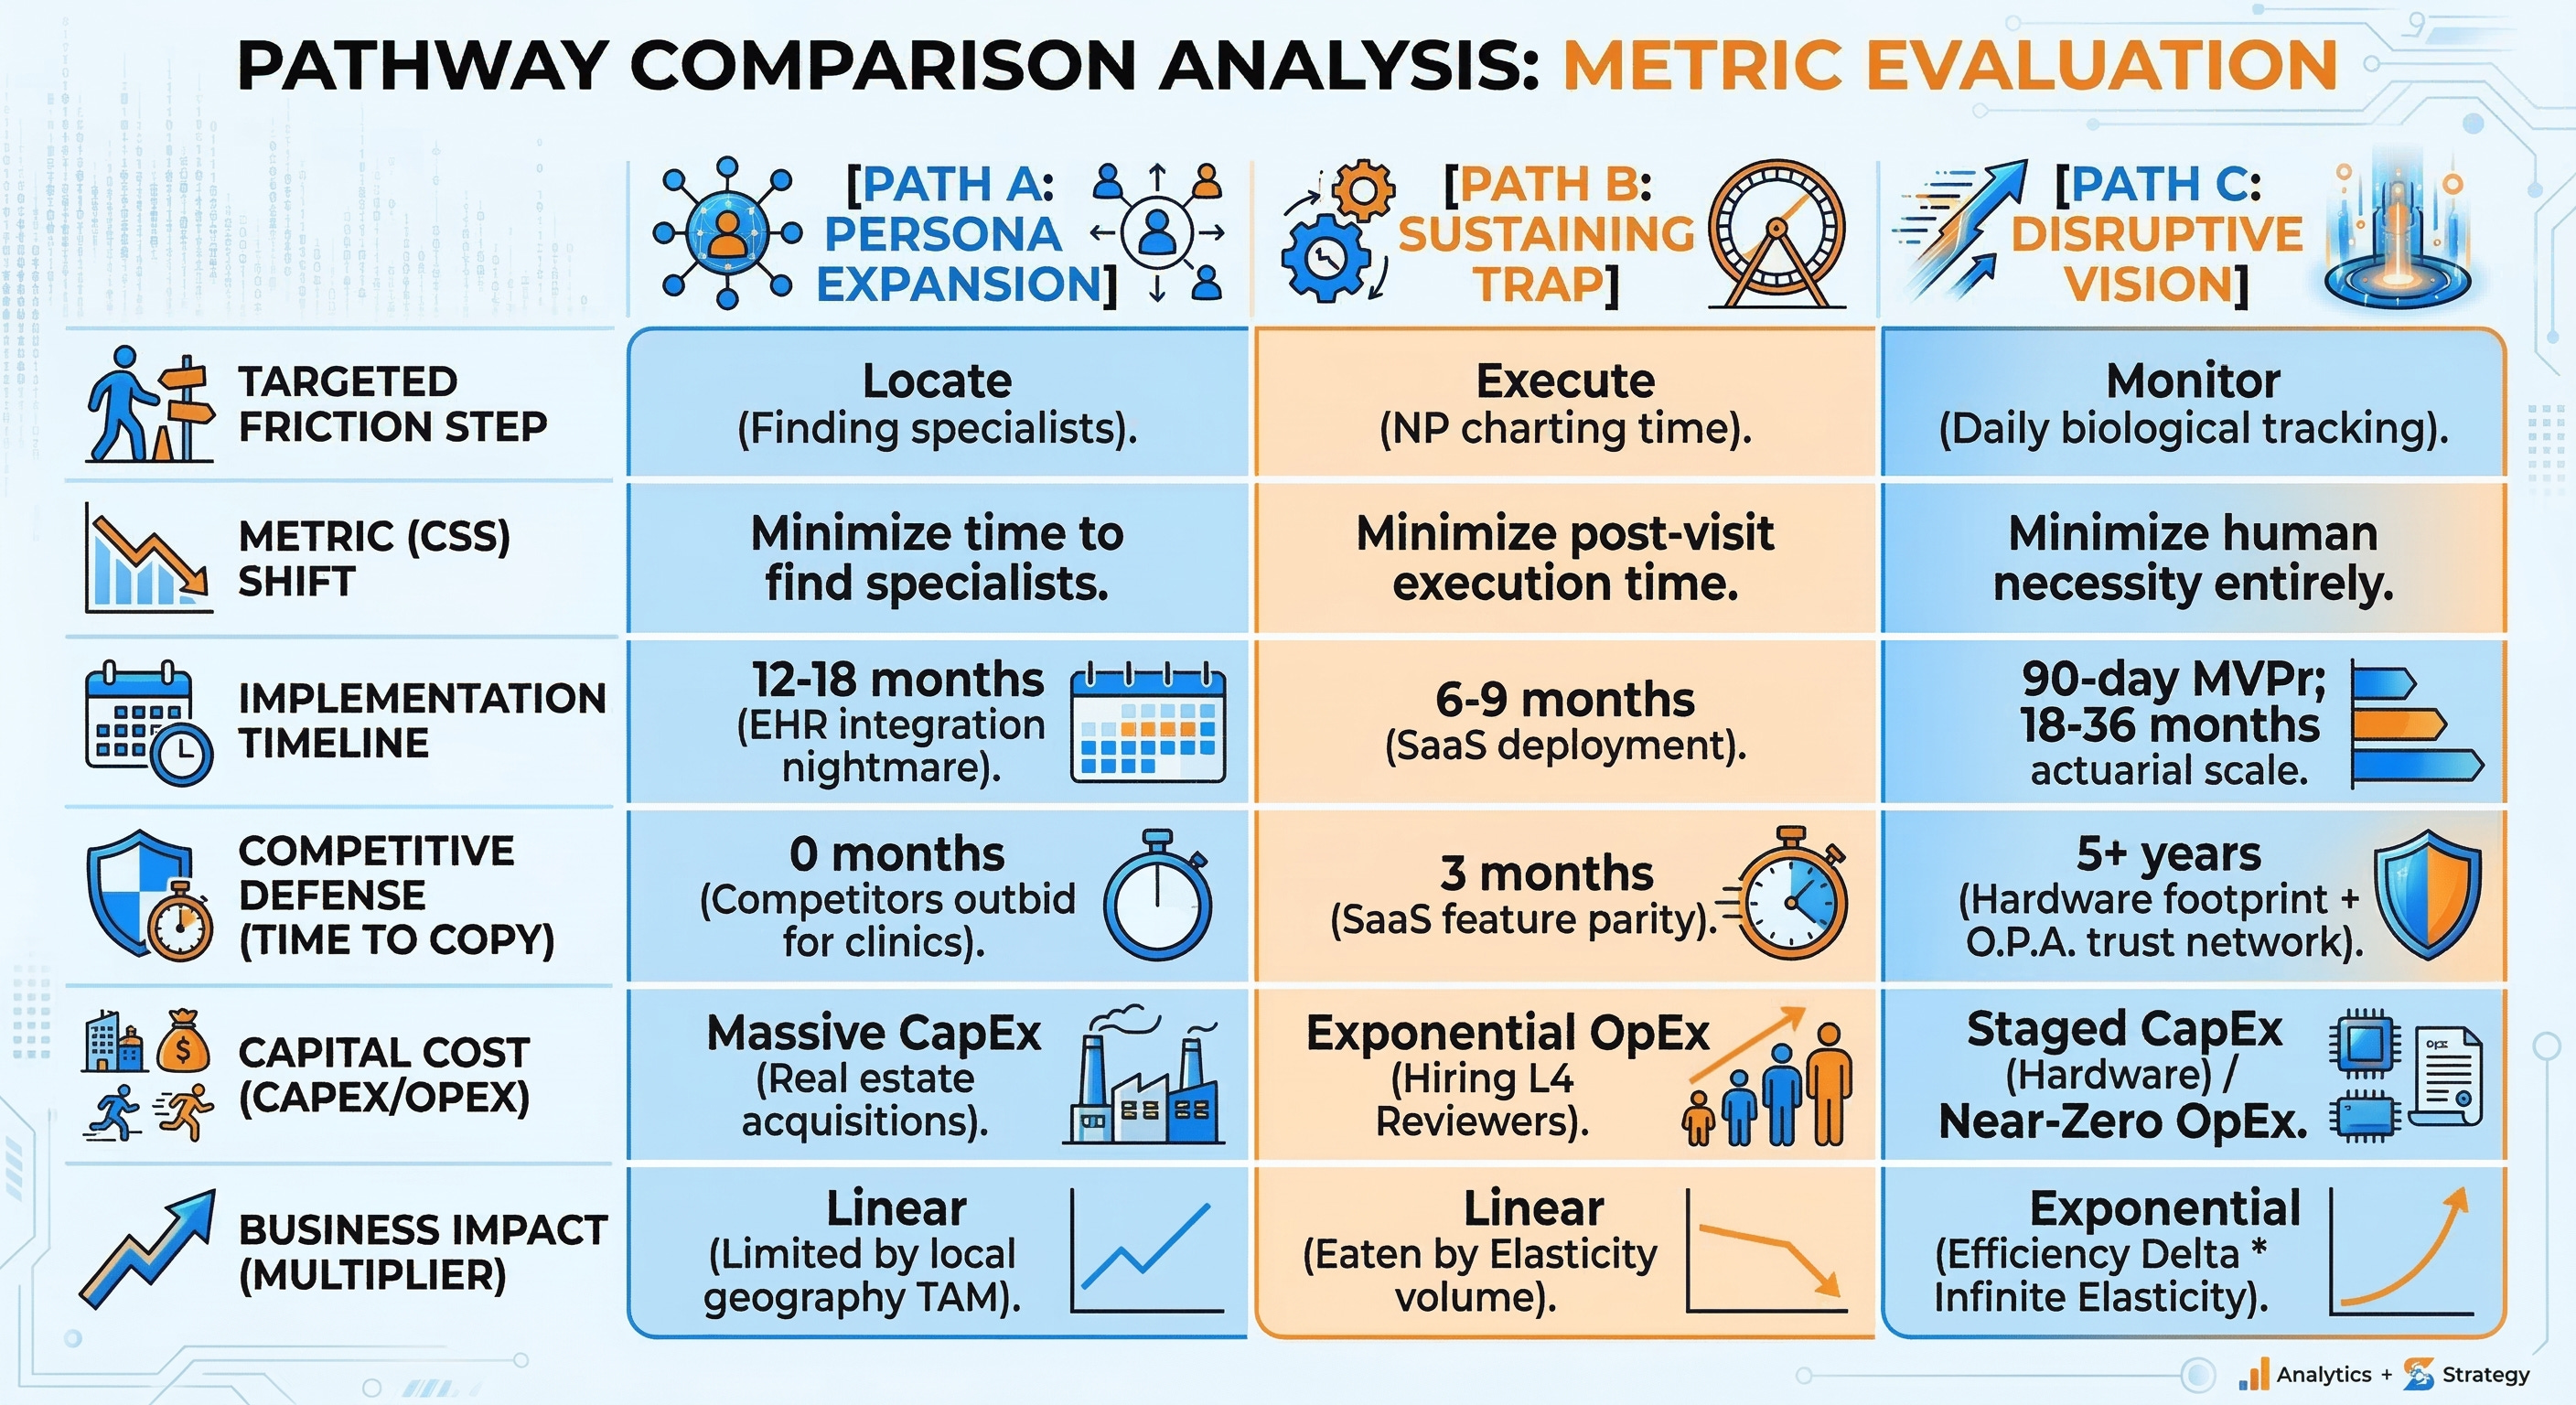
The strategic metrics for this pathway are grim. The Implementation Timeline stretches between 12 to 18 months, dictated entirely by grueling sales cycles with independent physicians and the nightmare of custom EHR integrations. More alarmingly, our Competitive Defense Timeline (Time-to-Copy) is practically zero. Because this strategy relies on acquiring physical clinics and hiring local NPs—rather than deploying proprietary structural moats—any competitor backed by private equity can replicate our move by simply offering a higher acquisition multiple to the clinic across the street.
Most dangerously, Pathway A ignores the Elasticity of Demand. Making it marginally easier for rural caregivers to Locate and book our specialists does not eliminate the necessity of the human visit. It just funnels a higher volume of synchronous demands toward our finite supply of clinicians. We are paying millions in CapEx to acquire a pipeline that will inevitably choke our own providers.
Pathway B: The Sustaining Trap & Elasticity Rebound
We are obsessed with making broken processes run faster. The tech industry loves to sell “Copilots” and predictive routing algorithms to healthcare organizations under the guise of margin expansion. We assume that if we give a Nurse Practitioner (NP) an AI scribe, they will finish their day earlier and the enterprise will bank the cash. This is a fundamental misunderstanding of behavioral economics and systems engineering. Optimizing the speed of a physical human in a hyper-elastic market does not generate savings; it generates an unmanageable explosion of volume. Let’s look at the mathematical trap of the sustaining innovation path.
Deploying AI Copilots to Accelerate CHW and NP Charting
Adding an AI scribe or a dynamic routing algorithm to a fundamentally flawed analog system just makes the flawed system run hotter. Primary care providers currently spend an astounding two hours on Electronic Health Record (EHR) documentation for every one hour of direct patient care. The natural corporate impulse is to buy software to fix this specific symptom.
Strategically, this intervention targets the Execute phase of the clinical visit. The Customer Success Statement (CSS) driving this investment is: Minimize the time it takes the Nurse Practitioner to Execute post-visit EHR documentation. We assume that by deploying an ambient listening AI, we can reduce that two-hour administrative burden down to 20 minutes, “freeing up” the clinician.
The reality is that this merely shifts the underlying friction. We are attempting to solve Overprocessing Waste without changing the structural architecture of the delivery model. The NP is still driving to the house. The Community Health Worker (CHW) is still sitting in traffic. We have not eliminated the physical denominator of the visit; we have only compressed the digital paperwork wrapping it.
The Jevons Paradox in Healthcare Logistics
Making a resource cheaper and more efficient mathematically increases its overall consumption, a phenomenon known as the Jevons Paradox. In healthcare logistics, this paradox is lethal. If an enterprise successfully uses AI to increase a clinician’s capacity from four visits a day to eight visits a day, the enterprise does not save 50% of its labor costs. Instead, the enterprise simply books eight visits.
We must account for the extreme elasticity of the patient population. High-needs, dual-eligible patients often suffer from profound isolation, health anxiety, and fragmented support structures. For this demographic, the demand for a “free,” in-home human connection is practically infinite.
Our research establishes a Demand Elasticity Factor of 2.5 (Hyper-Elastic) for this specific service. If we make it highly efficient for a provider to visit a home, patients will rapidly utilize the open scheduling slots for non-acute loneliness, minor ailments, or simple reassurance. The system absorbs the new capacity instantly, turning what was supposed to be a cost-saving measure into a volume-generating nightmare.
Mathematical Proof of the Infinite Volume Collapse
The naive math of time-savings ignores human behavioral economics, leading to catastrophic financial miscalculations in the boardroom. We must explicitly contrast the naive corporate forecast against the elastic reality of the market.
The Naive Reality: A Nurse Practitioner costs the enterprise ~$67/hr. Reducing charting time by one hour per shift looks like a hard savings of $67 per NP per day. New_Cost * Baseline_Volume = Static Savings. If we employ 100 NPs, the CFO models a linear, static savings of roughly $1.6M per year. The enterprise celebrates a massive reduction in operational expenditure (OpEx).
The Elastic Reality: Because demand is hyper-elastic (Factor 2.5), the newly “cheapened” friction of deploying a visit fundamentally alters consumption. The true mathematical formula is: New_Cost * (Baseline_Volume * (Old_Cost / New_Cost) ^ 2.5).
When the cost (measured in clinician time and logistical friction) drops, the baseline volume does not remain static. The volume of requested interventions explodes exponentially. The enterprise does not save $1.6M; instead, it is forced to hire more $140,000/yr NPs just to service the artificially inflated demand for non-acute human connection. The OpEx savings completely collapse under the weight of this newly induced volume.
How Faster Visits Create Unmanageable Senior Reviewer Bottlenecks
Increasing frontline throughput instantly crushes the finite supply of downstream L4 supervisors. You cannot speed up the frontline without reinforcing the back-end infrastructure. In a compliant value-based care model, Medicare and Medicaid mandate rigorous physician oversight for complex risk-adjustment and capitation billing.
For every five NPs running in the field, an MSO typically requires an overseeing Medical Director—a Primary Care Physician (PCP) costing upwards of $280,000/yr ($135/hr)—to review and sign off on complex care plans. When the AI Copilot allows those five NPs to double their daily visit volume, they instantly double the volume of charts sent to the reviewing PCP.
This proves that Pathway B fails the Lean Wastes audit. We have merely shifted the Overprocessing Waste at the NP level into massive Waiting Waste at the PCP level. The senior physician’s queue becomes an insurmountable backlog. Critical escalations get lost in a sea of perfectly formatted, AI-generated charts for minor ailments, creating fatal delays in the exact preventative care the system was built to provide.
The Illusion of OpEx Savings in a Human-Constrained Network
You cannot bank operational savings if the baseline mechanism of value delivery still requires a physical human presence. Pathway B is the ultimate illusion of progress. By keeping the L3 clinician in the loop as the primary data gatherer, we permanently cap our gross margins. The denominator remains physical travel, and the numerator remains expensive human labor.
This Sustaining Trap guarantees that our margins will flatten or invert as we attempt to scale. The induced volume from the Jevons Paradox requires the continuous, linear hiring of both frontline CHWs and downstream Senior Reviewers. We are building a bigger, faster hamster wheel. To truly disrupt the economics of population health, we cannot just make the human visit faster. We must delete the human visit entirely from the continuous monitoring loop.
Innovation Matrix Trigger Evaluation
We cannot solve a structural physics problem using a blank whiteboard. When executives are asked to brainstorm solutions for caregiver burnout or rising Total Cost of Care (TCOC), they universally default to analog, linear thinking—hiring more staff, buying better cars, or building new neighborhood hubs. To break the $140,000/yr clinical bottleneck and eliminate the transportation denominator, we must force the problem through the unabridged Innovation & Creativity Matrices. This forces us to invert our fundamental operating assumptions.
Analyzing the General Innovation Matrix (Structural Physics)
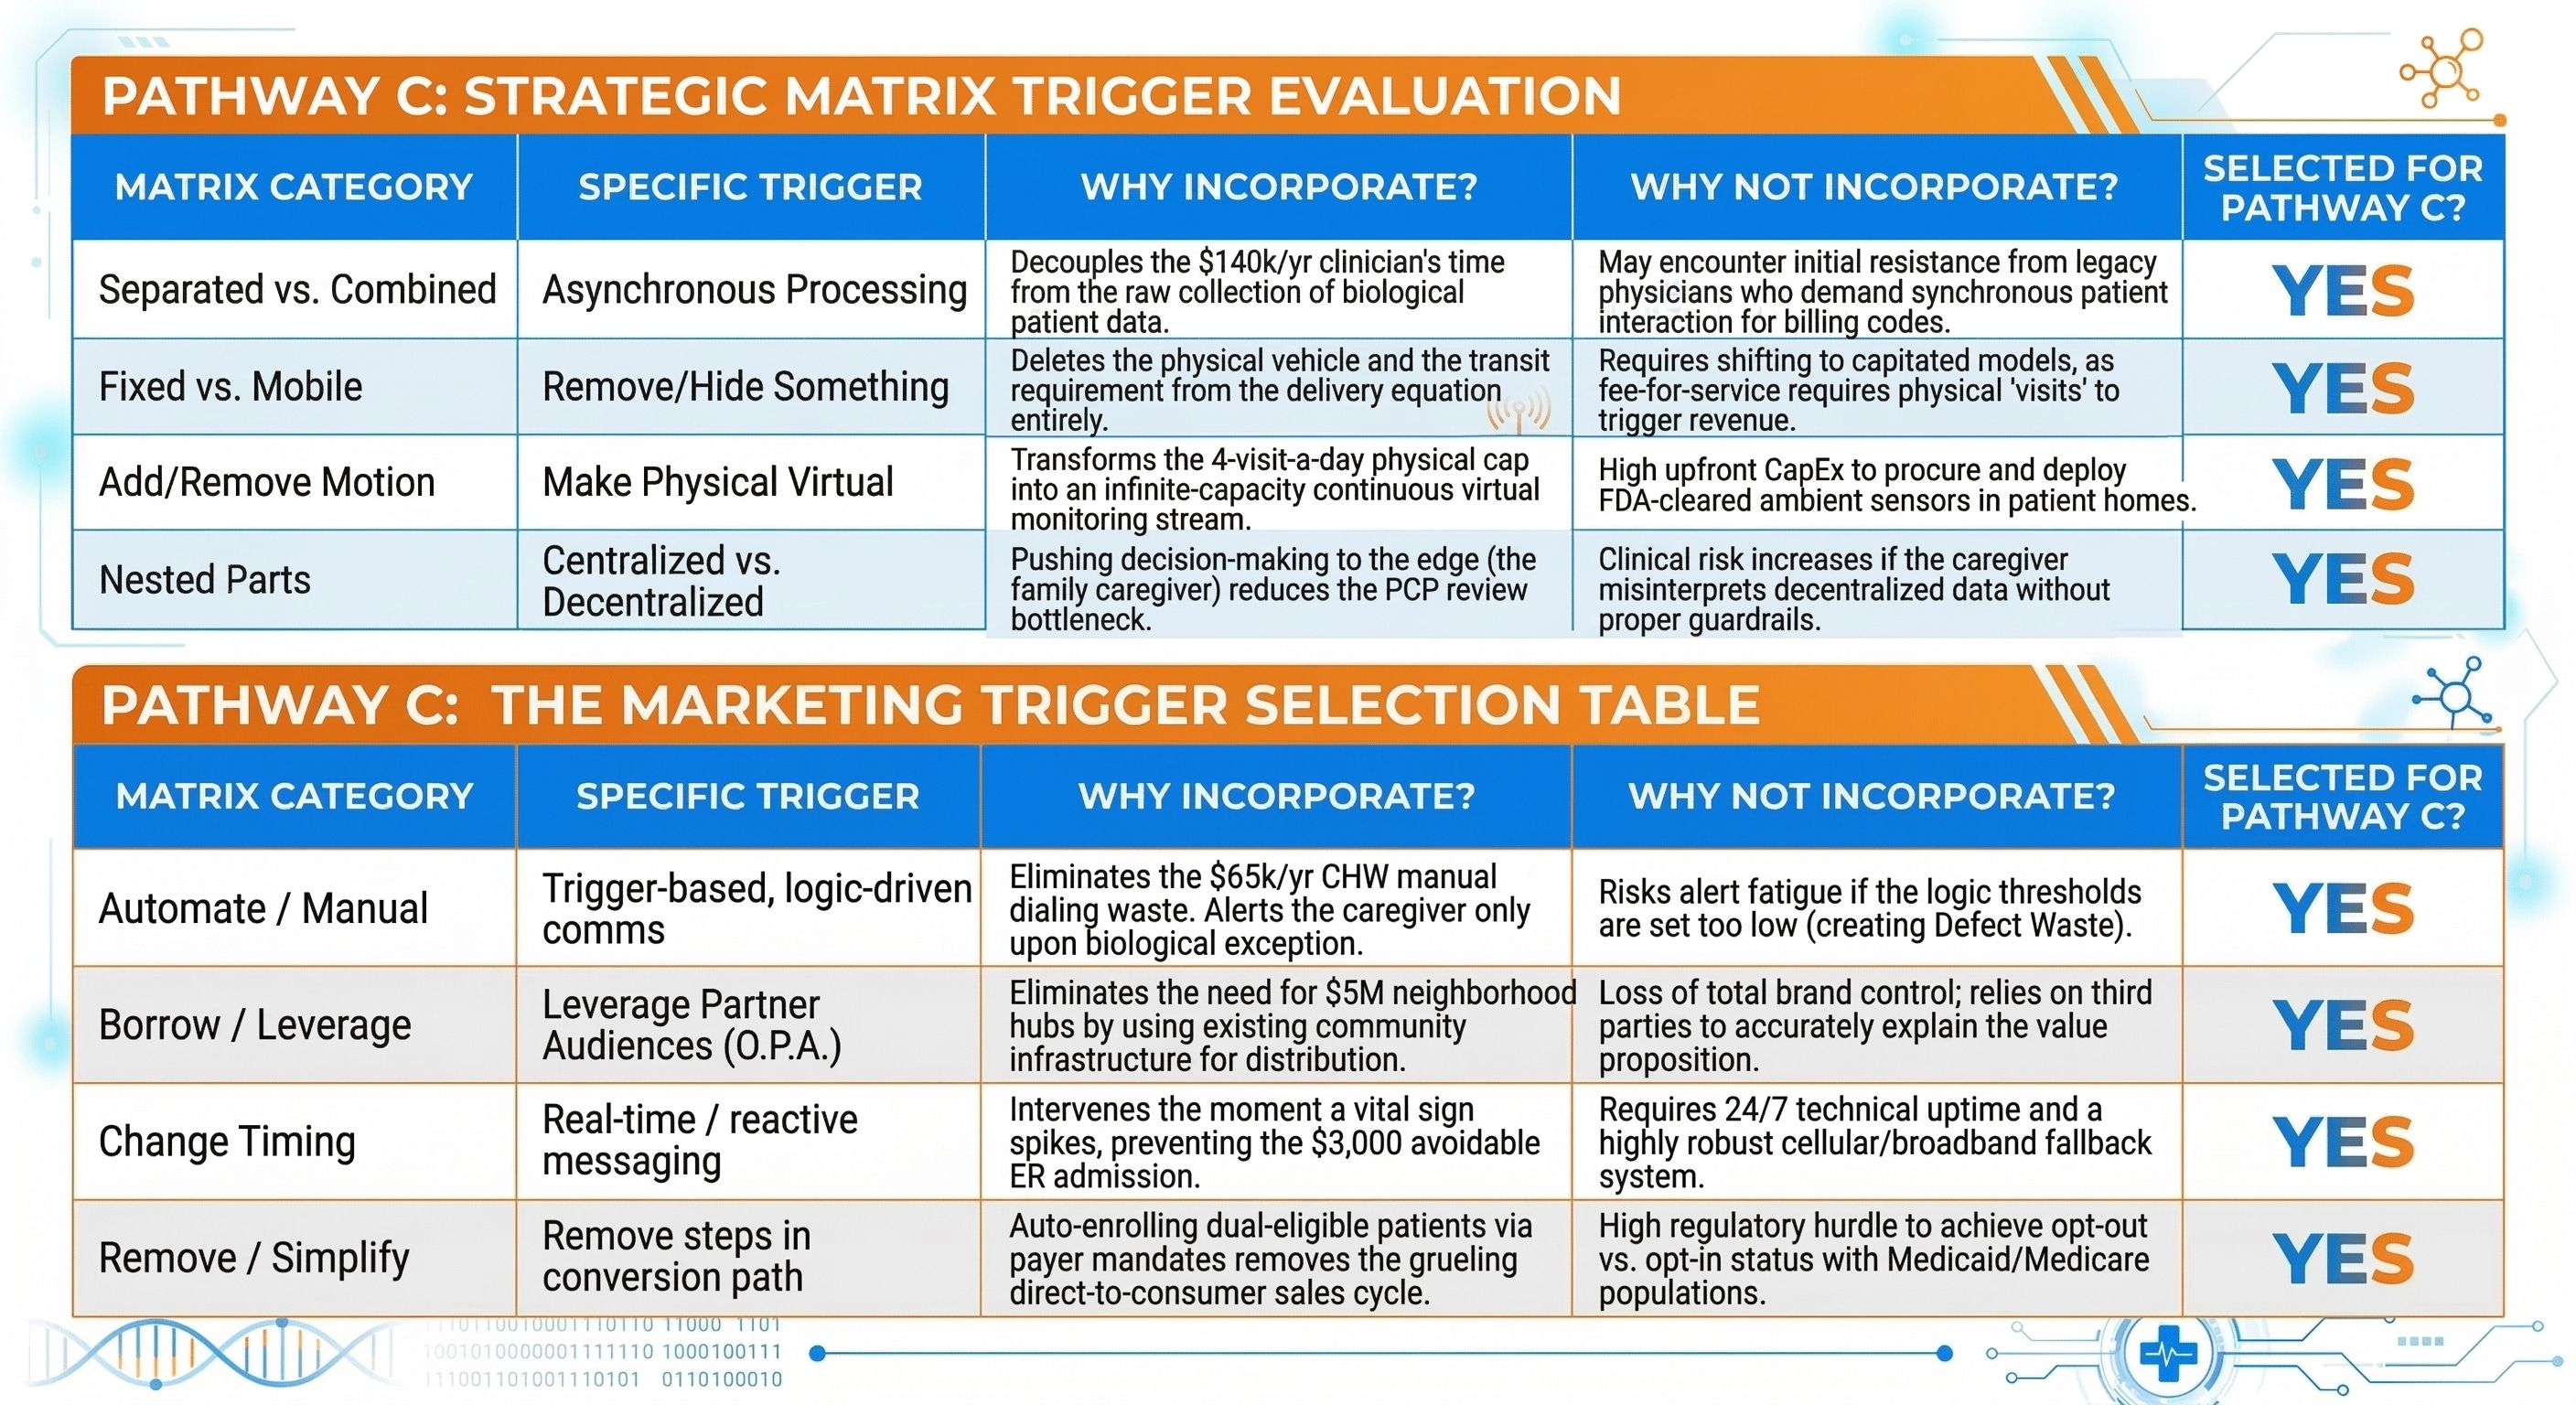
The legacy value-based care model is built on a “Combined” architecture. The gathering of biological data (checking a diabetic ulcer or taking blood pressure) is permanently combined with the physical presence of an expensive L3 clinician. This is a fatal coupling. To disrupt this, we must look at the Separated vs. Combined matrix triggers.
If we apply the Asynchronous (sequential) Processing trigger, we decouple the data collection from the clinical analysis. The biological data must be gathered ambiently and asynchronously, completely independent of the Nurse Practitioner’s daily schedule. Furthermore, we must deploy the Change the Location of the Solution in the Environment trigger. Currently, the diagnostic intelligence lives inside a centralized clinic or the trunk of a provider’s car. We must relocate that intelligence directly into the home via passive, continuous-monitoring hardware that requires zero human intervention to operate.
Additionally, we must evaluate the Add vs. Remove Motion/Movement category. The legacy system assumes that movement—driving the patient to the clinic, or driving the Community Health Worker (CHW) to the patient—is mandatory. By applying the Make something physical “virtual” trigger, we eradicate the physical denominator. The “visit” ceases to be a physical event; it becomes a continuous, virtual data stream. This structural shift is the only mathematical way to absorb the Hyper-Elastic (Factor 2.5) demand of vulnerable populations without triggering a proportional explosion in Operational Expenditure (OpEx).
Analyzing the Marketing Innovation Matrix (Go-to-Market)
Even if we fix the structural physics, we must radically alter how we acquire, train, and engage the Informal Family Quarterback. The legacy Go-To-Market (GTM) strategy relies on $65,000/yr CHWs manually knocking on doors or dialing phone numbers to convince exhausted daughters to comply with care plans. This manual outreach is a massive generator of Overprocessing Waste.
Applying the Automate / Manual trigger category is non-negotiable. We must transition from bespoke, manual outreach to Trigger-based, logic-driven communications. The system should only communicate with the Family Quarterback when the ambient sensors detect a biological anomaly that breaks a predefined threshold.
We must also leverage the Borrow / Leverage matrix category. Instead of spending millions in Capital Expenditure (CapEx) to build proprietary neighborhood clinics to establish trust, we must Leverage partner audiences (O.P.A. - Other People’s Audiences). Vulnerable populations already trust their local faith leaders, barbershops, and independent community pharmacists. By borrowing these existing trust nodes to distribute our ambient monitoring technology, we bypass the 18-to-36 month sales and trust-building cycle entirely, drastically accelerating our implementation timeline.
The Structural/Physical Trigger Selection Table
Synthesizing the Optimal Combination for Healthcare Delivery
By synthesizing these selected triggers, the blueprint for true disruption emerges. We are not just tweaking the margins of a clinic; we are orchestrating a complete structural inversion.
The synthesis of Asynchronous Processing, Making the Physical Virtual, and Trigger-based Logic directly attacks the highest-friction phases of the caregiver’s 9-step Job Map: the Monitor and Execute phases. Currently, the caregiver must manually monitor a declining patient and coordinate with a centralized clinic to execute a repair. Our matrix selection proves we must build a system where the home environment ambiently monitors the patient, and the software logic automatically dispatches the exact required intervention to the caregiver’s smartphone, bypassing the centralized clinic entirely.
This synthesized matrix eliminates the physical travel denominator. It neutralizes the Jevons Paradox because the “visit” no longer requires human labor—the system can absorb an infinite volume of digital vital-sign checks without costing the enterprise an additional dime in OpEx. The $140,000/yr Nurse Practitioners are removed from the routine data-collection loop entirely. They are repositioned as high-level exception handlers, deployed only when the ambient data indicates an imminent, acute collapse that the Family Quarterback cannot resolve. This specific combination of matrix triggers forms the undeniable, mathematical foundation for Pathway C: The Disruptive Vision Leap.
Pathway C: The Disruptive Vision Leap
We cannot outrun the math of a growing, aging population by simply hiring more clinicians to drive cars faster. True scale requires a fundamental break from physical reality. By transforming the environment itself into the diagnostic engine, we build a system that gets stronger, not weaker, as patient demand explodes.
The Labor Inversion: Decoupling Value from the L3 Clinical Visit
The fundamental flaw in legacy healthcare is the absolute coupling of biological data collection to the physical presence of an L3 clinician. A Labor Inversion structurally decouples revenue and value delivery from human Operational Expenditure (OpEx). We must completely separate the diagnostic intelligence from the Nurse Practitioner’s (NP) physical body.
Currently, an enterprise pays ~$140,000/yr for an NP to drive to a patient’s house just to verify a blood pressure reading and ask if the patient’s ankles are swollen. This relies on the human as the data-gathering sensor, capping their throughput at a maximum of 4 to 6 physical visits per day.
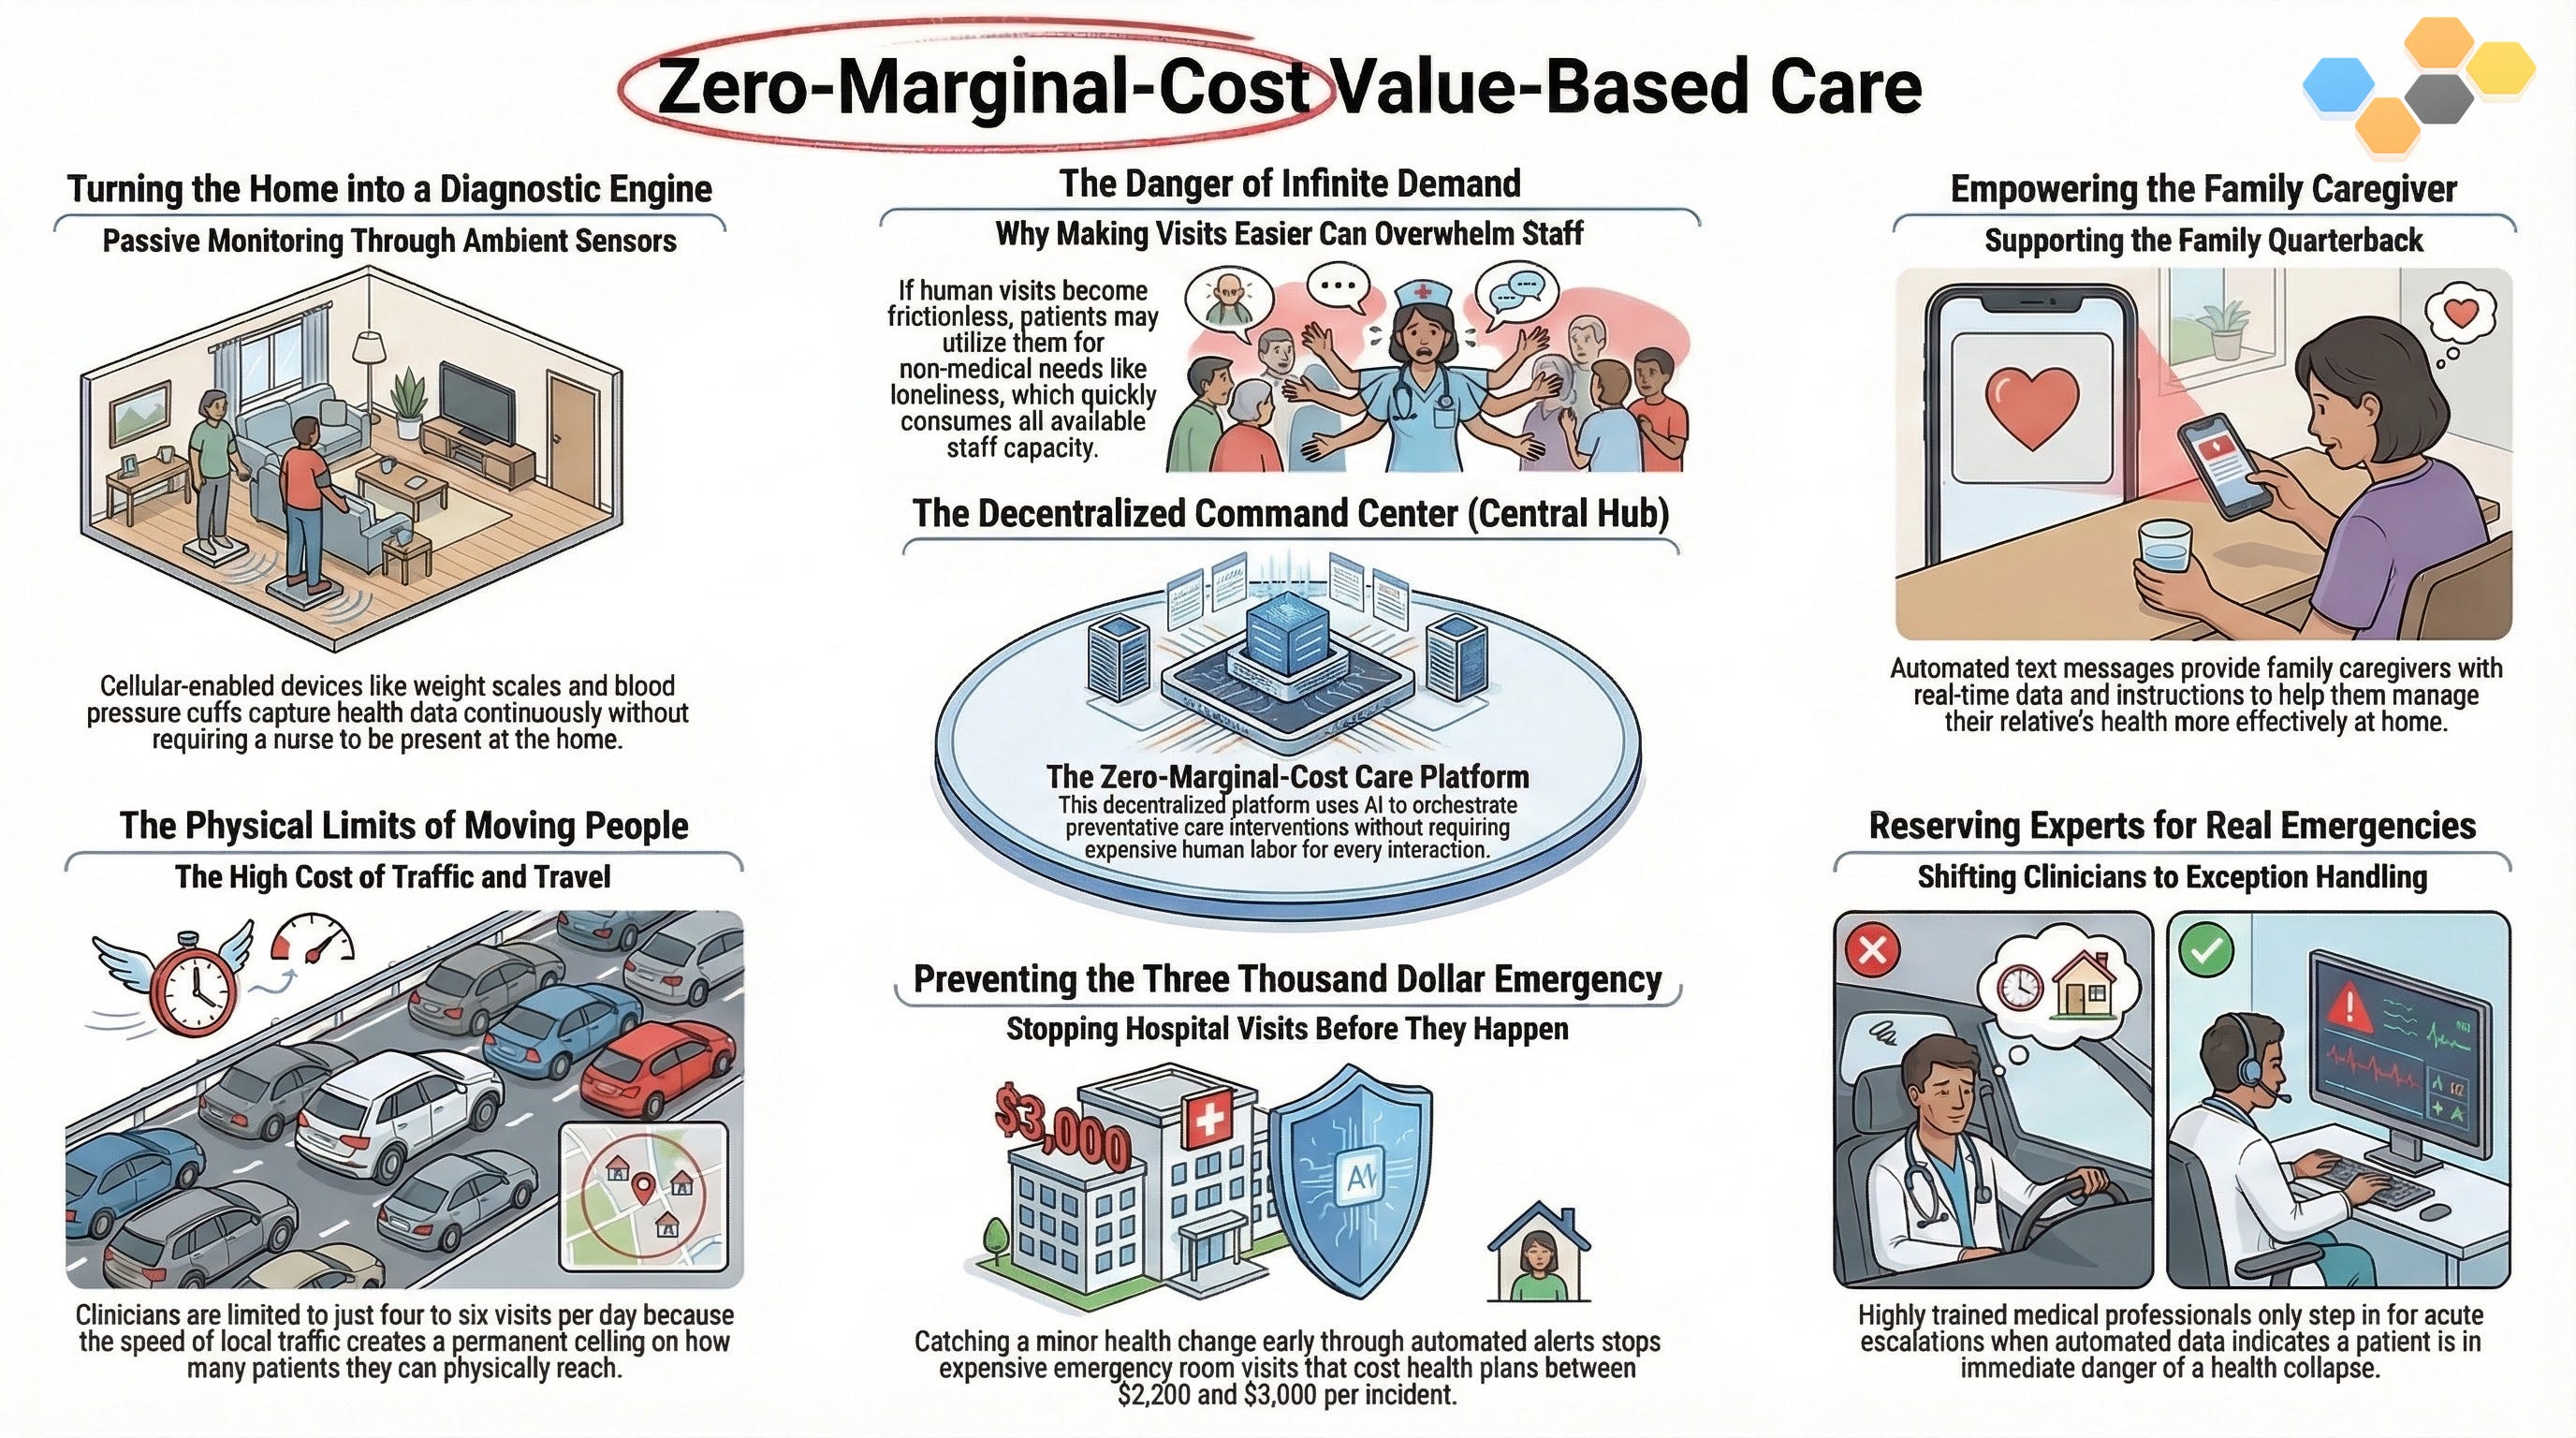
By deploying a Labor Inversion, we shift the fundamental unit of value delivery from billable human hours to scalable, agentic compute. The environment—equipped with passive, cellular-enabled weight scales, blood pressure cuffs, and ambient behavioral sensors—becomes the primary clinical observer. The human NP is removed entirely from the routine data-collection loop. The clinical asset is preserved in a centralized, virtual command center, deployed exclusively as a high-level exception handler when the biological data crosses a critical, acute threshold.
Architecting the Continuous, Zero-Marginal-Cost Preventative Network
Health is a continuous environmental state, not a transactional 15-minute event. To manage this continuous state profitably, we must build a preventative network that operates at zero marginal cost. When the environment itself is the sensor, checking a patient’s vitals ten times a day costs the enterprise exactly the same amount of money as checking it once.
This architectural leap directly solves the highest-friction phase of the Informal Family Quarterback’s Job Map: the Monitor phase. The Customer Success Statement (CSS) shifts radically from Pathway B. We are no longer trying to minimize the time it takes the caregiver to monitor vitals; we are structurally engineering the system to minimize the necessity of human intervention in the Monitor phase entirely.
If an elderly patient with Congestive Heart Failure gains three pounds of water weight overnight, the ambient scale detects this instantly. The Family Quarterback does not have to remember to log it. The NP does not have to drive across town to discover it. The network captures the data asynchronously, completely bypassing the physical limitations of urban traffic and the psychological exhaustion of the family caregiver. This guarantees that the silent biological escalation is caught days before it turns into a $3,000 avoidable ER admission.
Deploying the Selected Matrix Triggers: Separated Operations & Automated Inputs
To operationalize this zero-marginal-cost network, we must ruthlessly deploy the specific structural and marketing triggers we selected from the Innovation Matrices. We execute Separated Processing and Make the Physical Virtual by unbundling the traditional “care visit” into thousands of micro-interactions.
When that water-weight anomaly is detected, we trigger the Automate / Manual logic gate. The system does not immediately alert the $140,000/yr NP. Instead, it deploys a Trigger-based, logic-driven communication directly to the Family Quarterback’s smartphone. An automated SMS asks the daughter: “We noticed a 3lb weight increase. Did your mother eat a high-sodium meal last night, or is she experiencing shortness of breath?” If the daughter confirms a high-sodium meal, the system automatically logs the context and resets the baseline. Zero clinical OpEx was consumed. The Jevons Paradox—the hyper-elastic demand for connection (Factor 2.5)—is absorbed entirely by the algorithm. The patient and caregiver feel seen and continuously supported, but the enterprise pays nothing for the interaction. We only route the escalation to the NP if the daughter confirms shortness of breath. This is how you orchestrate a system that thrives on infinite volume.
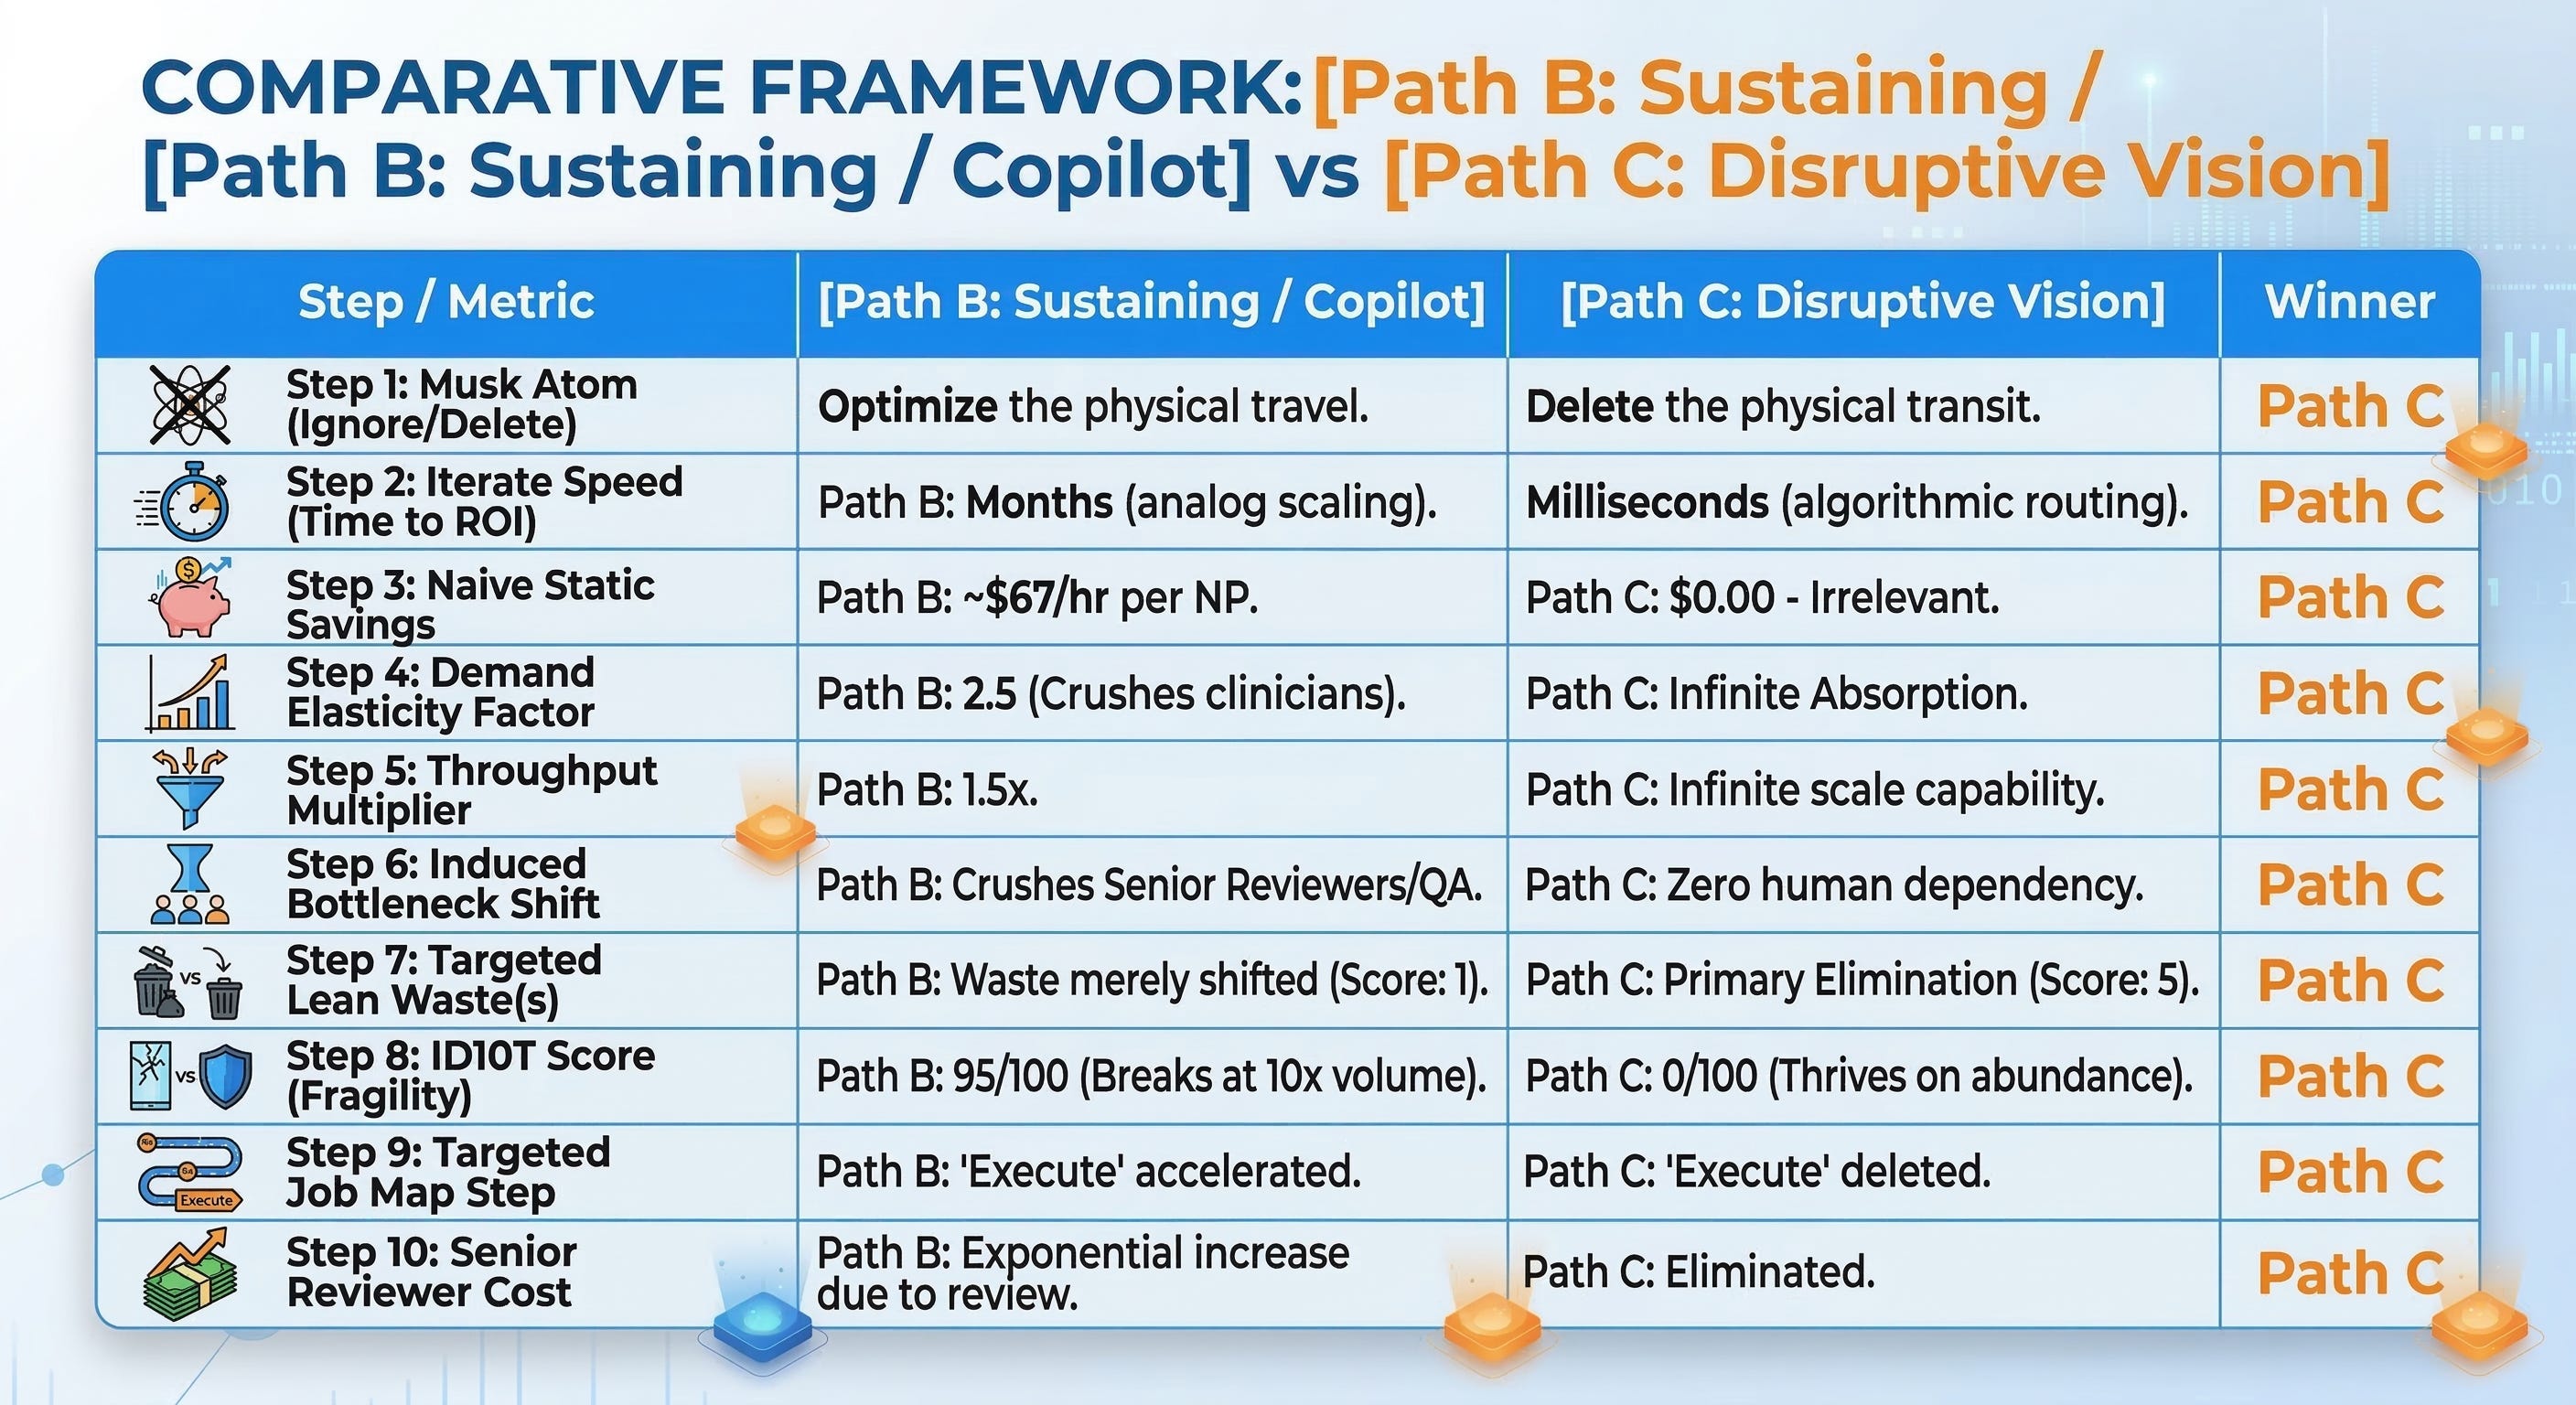
The Strict Decision Matrix: Path B vs. Path C
Core assertion: The physical L3 clinical visit must be deleted as the primary data-gathering mechanism, replaced by ambient sensor orchestration to survive infinite demand elasticity.
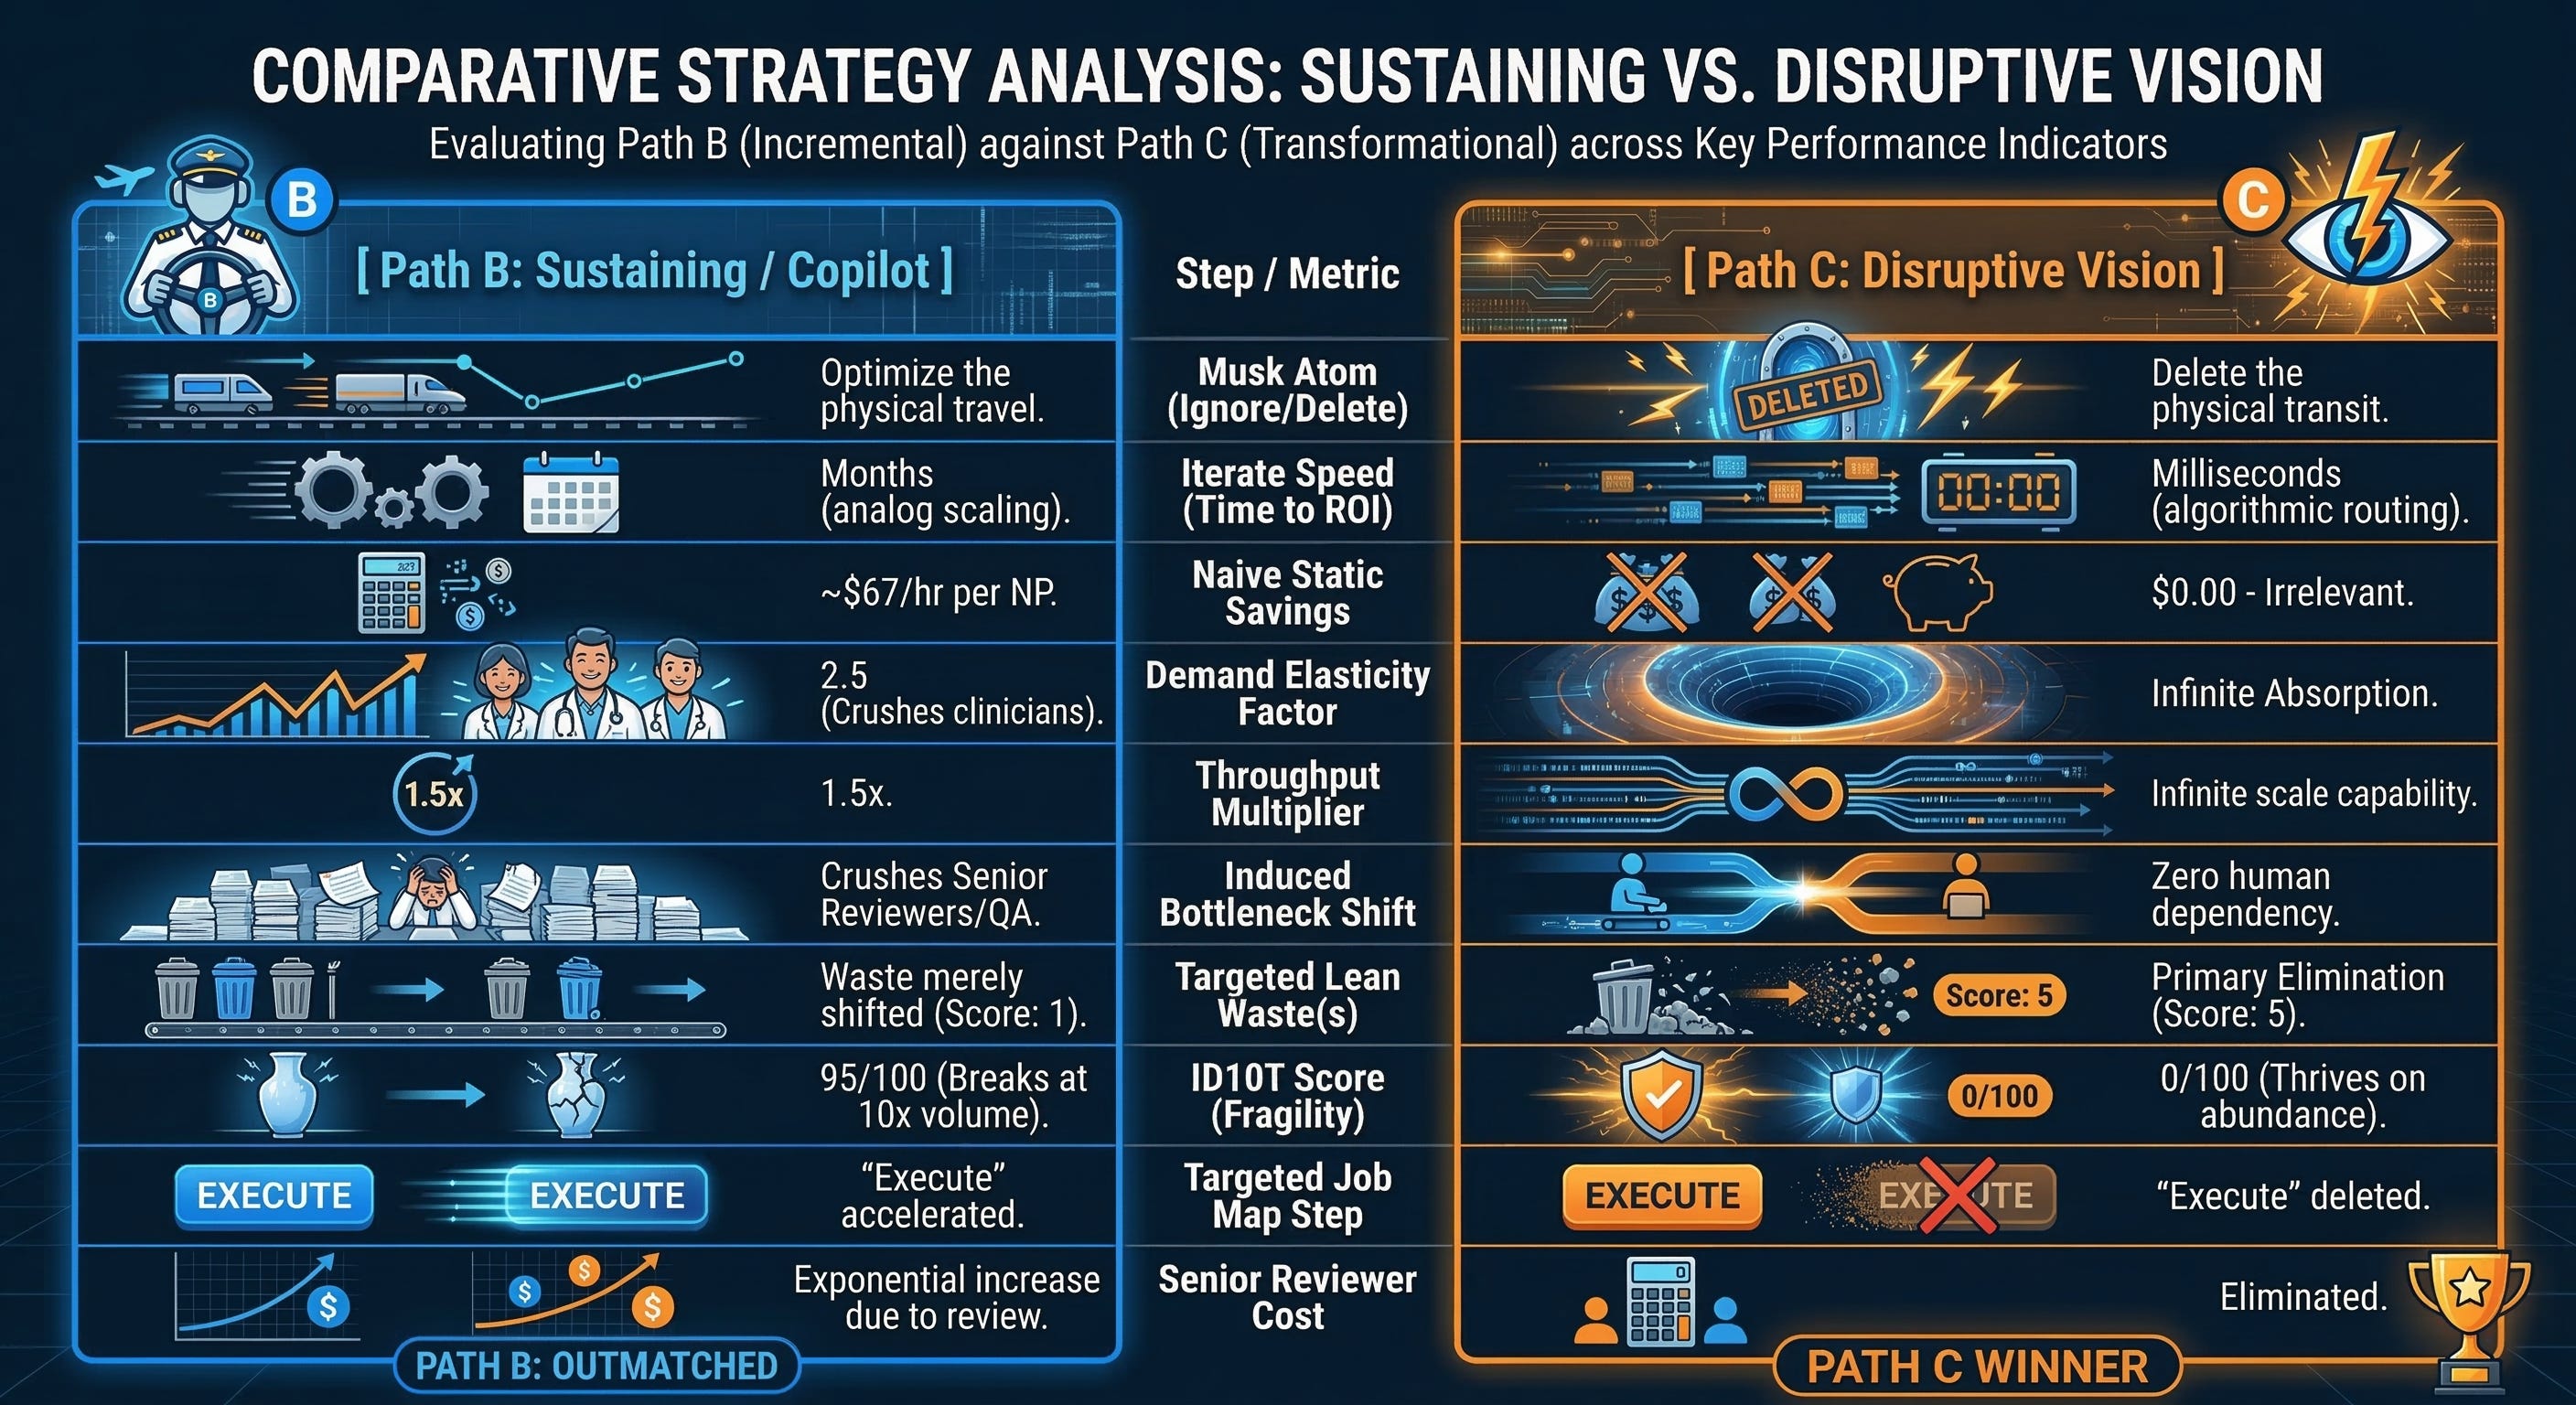
Implication: Pathway B is a fatal Rebound Trap that uses technology to accelerate a broken physical process, inevitably burying our downstream medical directors in AI-generated paperwork. Pathway C is the only mathematically viable option that breaks the linear relationship between patient volume and human clinical headcount.
Achieving Primary Waste Elimination and Infinite Scalability
Pathway C achieves a perfect score of 5 on the Lean Wastes audit by achieving Primary Elimination. We do not make the NP’s car faster; we eradicate Transportation Waste because the NP never leaves the command center. We do not give the NP an AI scribe to type faster; we eradicate Overprocessing Waste because the ambient sensors write the biological data directly into the risk-adjustment engine without human keystrokes.
Furthermore, we eliminate the Defect Waste of alert fatigue. Because the system utilizes the Family Quarterback as the first line of contextual triage (via automated SMS logic gates), the alerts that finally reach the NP’s dashboard are 100% verified, acute escalations. The clinicians are no longer chasing ghosts. They are practicing top-of-license medicine.
This is the ultimate competitive moat. Any private equity-backed competitor can buy the clinic across the street and hire a few Community Health Workers. But a competitor cannot quickly replicate a decentralized, hardware-enabled, zero-marginal-cost neural network that is deeply embedded in the homes of thousands of vulnerable patients. By embracing the Labor Inversion and deleting the physical visit, we build a value-based care enterprise that is entirely immune to the geographic constraints and labor shortages crippling the rest of the healthcare industry.
Pathway C Implementation: The Real Options Staged Bets
You cannot innovate in healthcare if your finance department treats exploration like execution. The legacy enterprise demands a comprehensive business case proving exactly how many millions a new technology will save before allocating a single dollar of budget. This forces product teams to lie. They invent adoption metrics and forecast linear savings that will inevitably collapse under the hyper-elastic demand of the market. To execute Pathway C safely, we have to completely rewrite the financial governance model. We are not funding a massive rollout; we are purchasing a series of strategic options.
Escaping the Monolithic Fallacy in Health Tech Investment
The healthcare graveyard is filled with $50 million predictive analytics platforms that nobody uses. This happens because of the Monolithic Fallacy. Leadership commits massive Capital Expenditure (CapEx) to build the entire “factory” before proving that the underlying logic actually solves a problem for the end-user.
Real Options Analysis fundamentally shifts this dynamic. We treat an R&D budget not as an operational cost, but as a premium paid to purchase the right to make a future decision. We are systematically buying information to reduce epistemic uncertainty. Instead of asking the board for $10 million to buy ambient sensors for a vulnerable population, we ask for $50,000 to prove the Informal Family Quarterback will actually respond to a text message alert. If the first bet fails, we abandon the option with near-zero capital loss, escaping the sunk-cost trap that plagues legacy health systems.
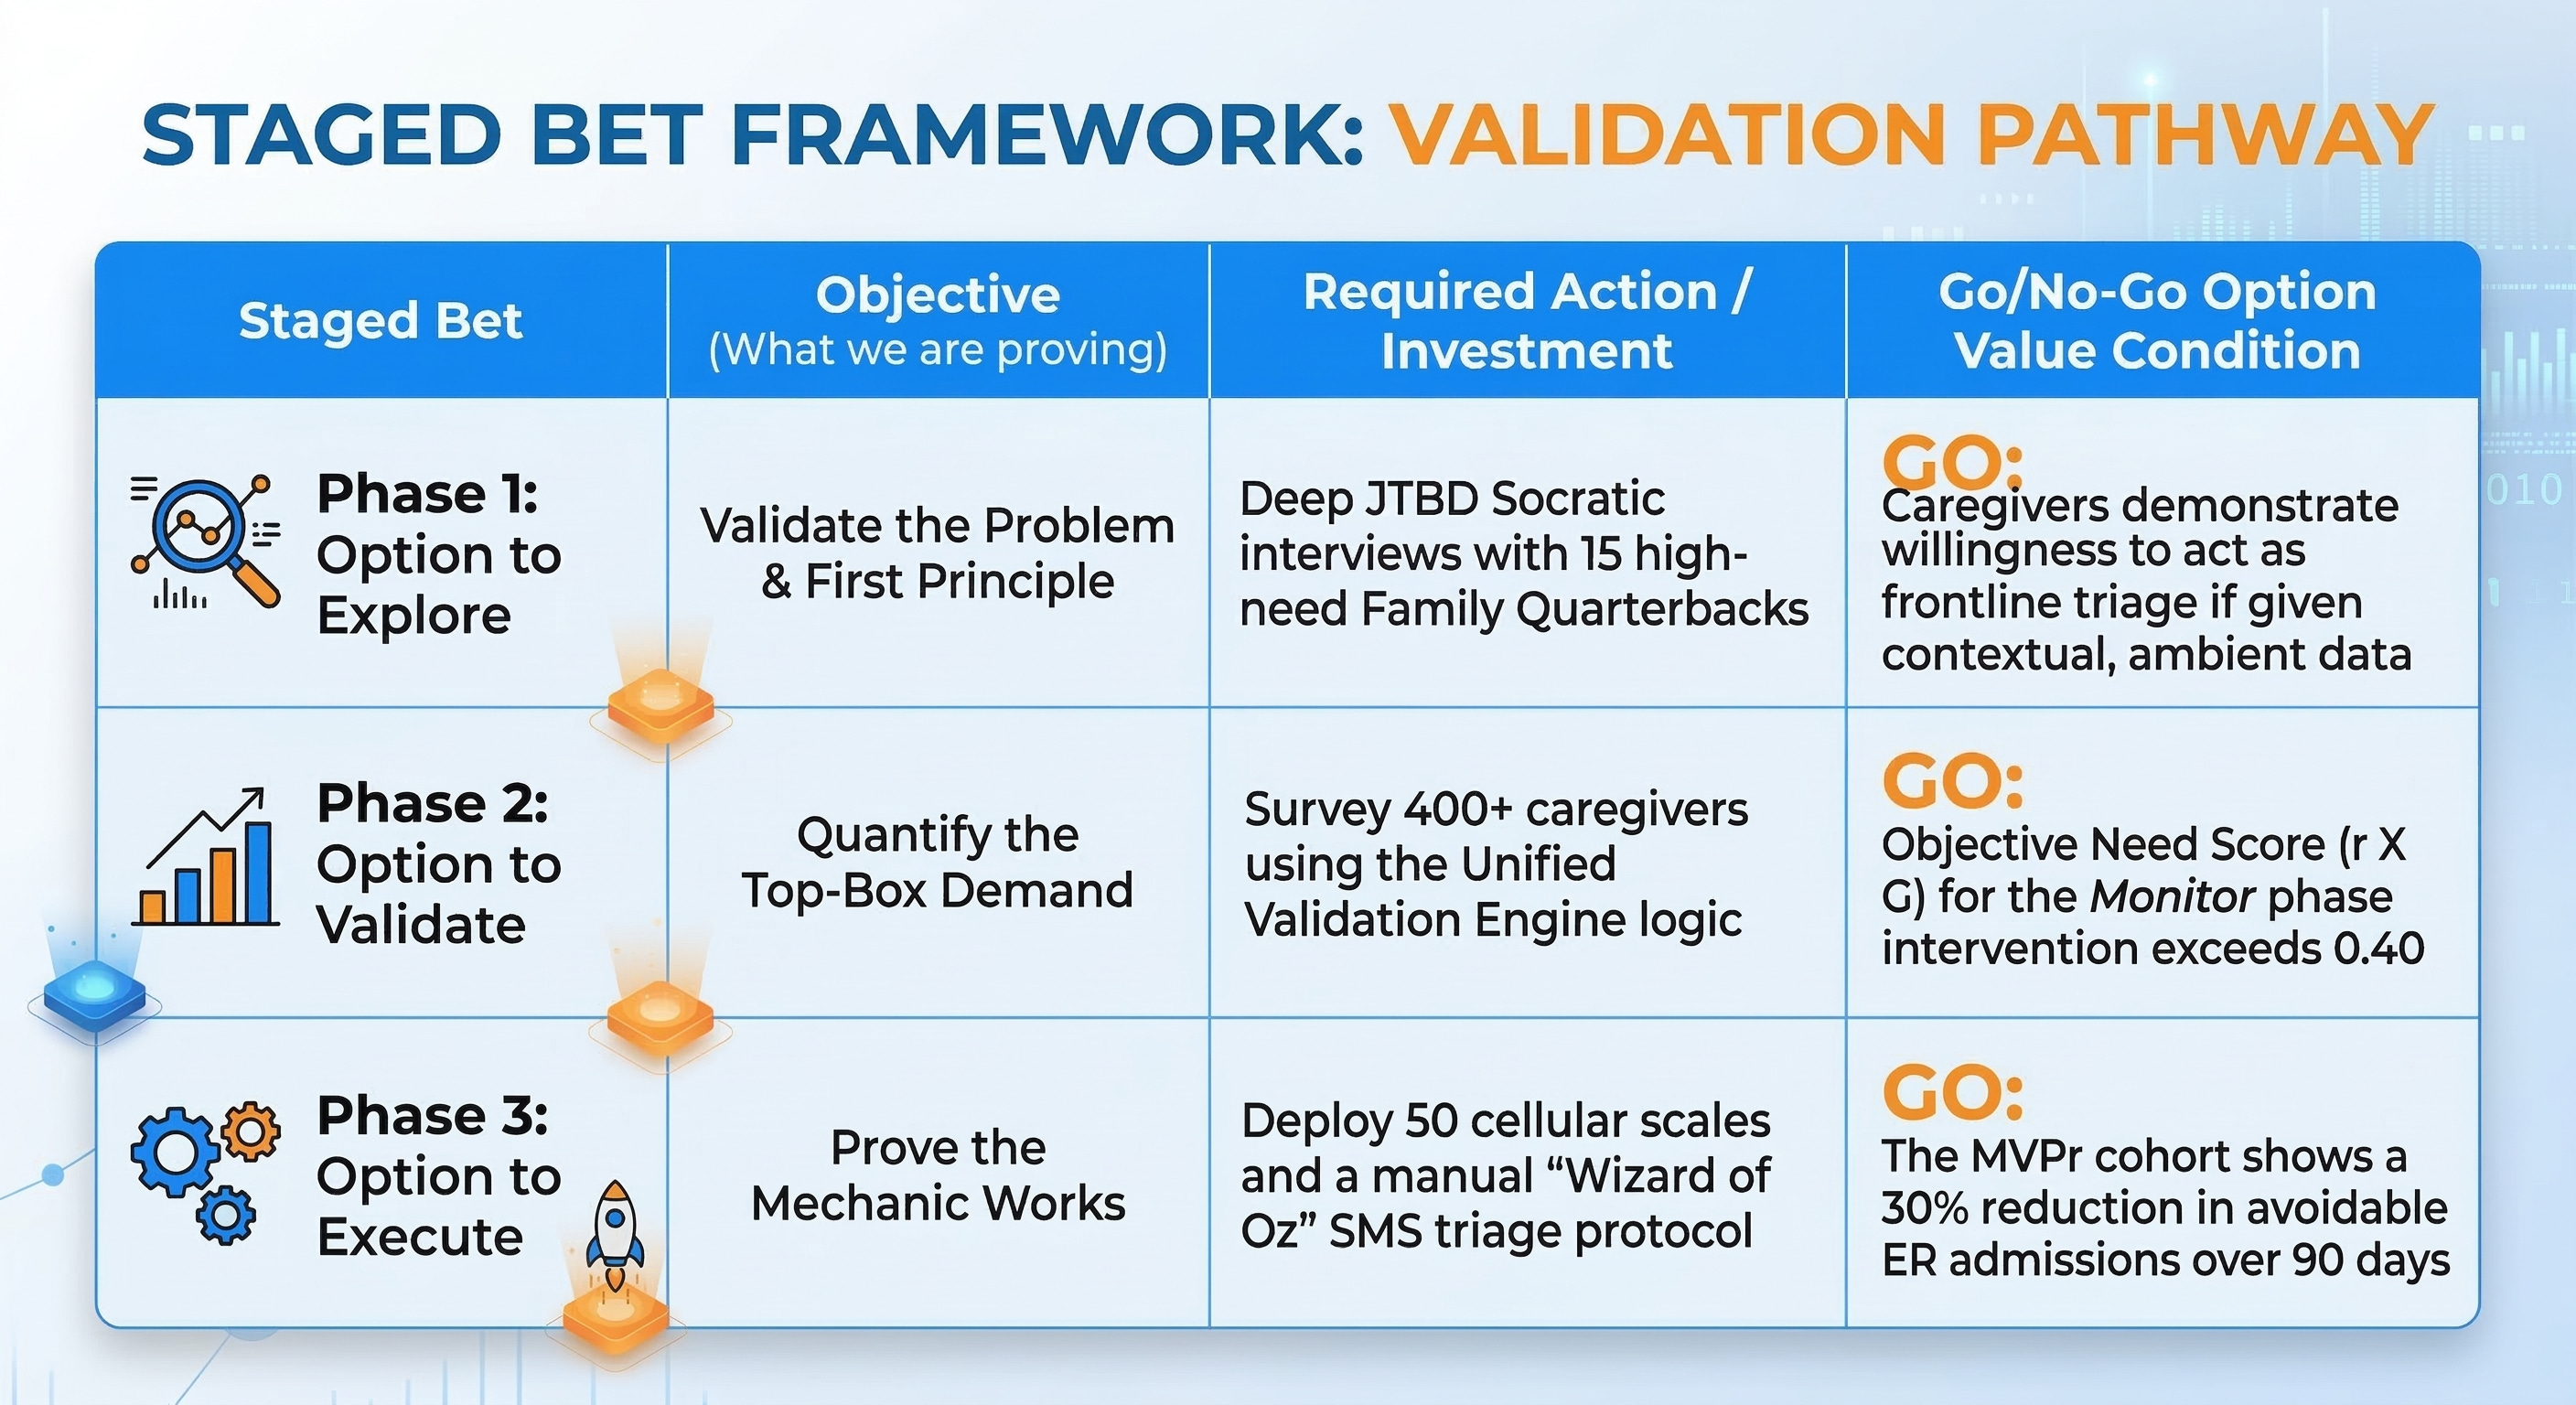
Phase 1: The Option to Explore (Socratic Validation & First Principles)
The first staged bet requires zero software engineering. The objective is to rigorously validate the problem and strip away our institutional solution-bias. We deploy the Socratic Deconstructor to interrogate our core assumption: Will decentralized, ambient data actually empower the caregiver, or will it just induce more anxiety?
We execute this by identifying 15 high-need Family Quarterbacks managing Congestive Heart Failure (CHF) patients. We conduct deep, qualitative Jobs-to-be-Done (JTBD) interviews.
Phase 2: The Option to Validate (Quantifying Top-Box SDoH Demand)
Qualitative interviews give us the narrative, but they do not justify capital deployment. We need mathematical certainty. Phase 2 requires deploying the Unified Validation Engine to survey a statistically significant cohort (n=400+) of Family Quarterbacks.
We test specific Customer Success Statements (CSS) related to the Monitor and Execute phases of their Job Map. We are looking for the Urgency Gap (G) and Derived Importance (r). We refuse to look at average Likert scores. We isolate the Top-Box (4 or 5) responses to find the undeniable market truth. If the Objective Need Score for automating the Monitor phase exceeds our threshold (typically a score > 0.40), we have mathematical State 3 proof that the market desperately needs this exact intervention. We unlock the Option to Execute.
Phase 3: The Option to Execute (The MVPr Concierge Service)
We do not immediately scale the architecture. We build a Minimum Viable Prototype (MVPr)—a highly manual, “Wizard of Oz” concierge service—to prove the unit economics work in the real world.
We procure 50 basic, off-the-shelf cellular weight scales and deploy them to a cohort of our highest-risk patients. We do not build an expensive, automated logic engine. Instead, a single Nurse Practitioner (NP) sits behind a dashboard monitoring the raw data stream. When a weight anomaly hits, the NP manually types out the SMS text message to the caregiver, pretending to be the automated system.
We are testing the behavioral mechanic, not the software. Can this manual intervention intercept a physiological decline before it becomes a $3,000 avoidable ER admission? If the MVPr proves that triggering the caregiver via SMS successfully diverts 30% of expected ER utilization within 90 days, we have proven the structural Inversion. The unit economics are sound. We have earned the right to fully fund the backend automation and scale the hardware deployment across the entire population.
The Strategic Metrics & Timeline Comparison
A brilliant strategy without a timeline is just an expensive hallucination. The market does not reward theoretical savings; it rewards the ruthless execution of asymmetrical advantages. We need to strip away the corporate optimism and look at the brutal math of time, cost, and competitive defense to see which pathway actually survives contact with the real world.
Evaluating Cost, Impact, and Defensive Moats Across All Pathways
You cannot evaluate a strategic pathway without measuring its fragility to scale. Pathway A (expanding physical clinics) requires massive, immediate Capital Expenditure (CapEx) to sign 10-year leases and buy out rural practices, buying top-line revenue at the expense of the balance sheet. Pathway B (AI scribes) looks like a cheap Operational Expenditure (OpEx) software play, but it masks a hidden, exponential OpEx curve. Because the Jevons Paradox induces explosive volume (Elasticity Factor 2.5), Pathway B forces the continuous, linear hiring of $280,000/yr Primary Care Physicians (PCPs) just to review the AI-generated paperwork.
Pathway C completely inverts this economic reality. It demands a moderate, staged CapEx investment to procure FDA-cleared ambient sensors for the home. However, once deployed, the OpEx for the Monitor phase drops to near-zero. The business impact is not a linear savings calculation; it is a mathematical multiplier. Because algorithms handle the hyper-elastic demand for daily check-ins without human labor, Pathway C captures the entirety of the Efficiency Delta, permanently severing the link between patient volume and clinical headcount.
Narrating the Implementation Timeline for Disruption
Time-to-value is the ultimate arbiter of success in value-based care. Pathway A guarantees a grueling 12-to-18-month implementation timeline strictly due to the technical debt of integrating external Social Determinants of Health (SDoH) data with fragmented, legacy Epic and Cerner EHR instances. Pathway B offers a deceptively fast 6-to-9-month software deployment, but it only optimizes a broken process, delivering no structural disruption.
Pathway C operates on a bifurcated timeline. The Minimum Viable Prototype (MVPr)—the manual SMS concierge service—launches in just 90 days. Scaling the fully automated hardware network across a capitated population requires 18 to 36 months of actuarial validation to secure downside risk contracts from CMS. However, by utilizing the “Borrow / Leverage” marketing trigger and relying on Other People’s Audiences (O.P.A.)—like local faith leaders and independent pharmacists—we bypass the 5-year timeline typically required to build physical neighborhood hubs and establish community trust from scratch.
The Strategic Metrics & Timeline Comparison Card
Analyzing the Competitive Defense Timeline (Time-to-Copy)
A strategy is worthless if a private equity-backed competitor can replicate it in a financial quarter. Pathway A possesses a Competitive Defense Timeline of exactly zero months. Because it relies entirely on acquiring physical clinics and hiring local Nurse Practitioners ($140,000/yr), a competitor simply has to offer a slightly higher acquisition multiple or sign-on bonus to neutralize your market share. Pathway B is equally fragile. AI scribes and dynamic routing are standard SaaS features; the moment you prove they work, every major EHR vendor will patch them into their baseline offering within three months.
Pathway C constructs a 5+ year defensive moat. You are not just deploying software; you are physically embedding hardware into the living rooms of the most vulnerable patients. You are building a proprietary, longitudinal data stream of ambient SDoH and biological markers that no legacy hospital system possesses. Coupled with the trust network established through O.P.A. deployment, this architecture creates a switching cost so high that competitors are mathematically locked out of the ecosystem.
Final Executive Recommendation for Capital Allocation
The mandate is clear: abandon the analog routing model. The enterprise must immediately halt all massive CapEx acquisitions of physical clinics (Pathway A) and freeze the rollout of clinician-facing AI optimization tools (Pathway B). Funding these initiatives is tantamount to setting capital on fire, as both will inevitably collapse under the weight of hyper-elastic demand and $280,000/yr Senior Reviewer bottlenecks.
Leadership must reallocate budget entirely to the Real Options deployment of Pathway C. By funding the $50,000 Option to Explore and subsequent Top-Box Validation, the enterprise systematically buys the information needed to execute the Labor Inversion. This is the only strategic pathway that engineers an operational framework capable of profitably intercepting a $3,000 avoidable ER admission at zero marginal cost.
External FAQ (Validating Adoption)
You can design the most brilliant zero-marginal-cost architecture in the world, but if the patient’s exhausted daughter doesn’t understand how to plug it in, your model fails. Adoption is never about clever marketing; it is entirely about eliminating human friction. We have to explicitly prove to the Informal Family Quarterback that our ambient sensors will save their sanity, not just our corporate bottom line.
Pricing and Capitation Mechanics for the Patient
How much does this continuous monitoring program cost the family?
The hardware and the ambient monitoring service cost the patient and their family exactly $0.00 out-of-pocket. We are not operating a direct-to-consumer retail model. The program is fully subsidized by participating Medicare Advantage and managed Medicaid plans.
Because we operate in a downside-risk capitated model, the health plan pays us a fixed monthly premium to keep the patient healthy. We gladly absorb the moderate upfront Capital Expenditure (CapEx) to purchase and ship the cellular weight scales and blood pressure cuffs. Catching a 3-pound water weight gain early via an automated SMS costs us pennies; missing it costs the enterprise a $3,000 avoidable ER admission. The unit economics of prevention allow us to permanently eliminate the financial friction for the patient.
Workflow Visualization for the Family Caregiver
How exactly does this change my daily routine as a caregiver?
We completely delete the Monitor phase from your daily Job Map. You no longer need to write your father’s blood pressure readings into a spiral notebook or try to verbally relay them to a rushed doctor over the phone.
The workflow is entirely passive. The patient steps on a cellular-enabled scale in their bathroom. The data instantly transmits to our algorithmic command center without requiring Wi-Fi passwords or Bluetooth pairing. If the system detects a biological anomaly, it deploys a logic-driven SMS text message directly to your phone, asking a simple contextual question. You reply with a “Yes” or “No.” We have replaced the two-hour logistical nightmare of a clinic visit with a five-second text message.
Differentiation from Standard Home Health Agencies
What makes this different from the home health nurse who already visits twice a month?
Standard home health agencies scale a fragile, analog process. They send a $140,000/yr Nurse Practitioner (NP) to sit in traffic, creating massive Transportation Waste, just to ask standard intake questions. Because their capacity is strictly capped by the speed limit, they only see the patient every two weeks. Biological decline does not operate on a bi-weekly schedule.
We operate a Labor Inversion. We separate the data collection from the physical human. Our ambient sensors watch the patient continuously, 24/7, at zero marginal cost. By utilizing algorithms to absorb the hyper-elastic demand for daily check-ins, we reserve our human NPs exclusively for acute, high-risk escalations. We are not a visiting nurse agency; we are a continuous biological safety net.
Implementation Friction and Time-to-Value
How long does it take to set up, and do I need to download a complicated app?
Your time-to-value is under five minutes, and there are absolutely zero apps to download. Healthcare apps create massive Overprocessing Waste because elderly patients forget their passwords and caregivers abandon the portals.
We utilize the Borrow / Leverage marketing trigger by using the SMS infrastructure you already use every day. The FDA-cleared hardware arrives pre-configured with a built-in cellular SIM card. You simply unbox the device and plug it into a standard wall outlet. The moment the patient uses it for the first time, the baseline is established, and the continuous monitoring algorithm goes live immediately.
Ecosystem Integrations and Medicare/Medicaid Portability
Will this data sync with my mother’s existing primary care doctor at the local hospital?
Yes, but you never have to manage that integration yourself. Our backend infrastructure is designed to bridge the technical debt between our continuous data stream and legacy hospital Electronic Health Records (EHRs) like Epic and Cerner.
During the Execute phase of your Job Map, our centralized command center automatically formats the ambient data and pushes it into the local physician’s existing workflow. Furthermore, because the hardware is tied to the patient’s capitated health plan rather than a specific physical clinic, the monitoring safety net moves with the patient even if they change local primary care providers.
Data Privacy and Continuous Monitoring Security
Is it safe to have these sensors transmitting my family’s health data from our home?
Your data is infinitely more secure than an analog paper chart sitting on a clipboard. We completely bypass the vulnerabilities of local home Wi-Fi networks. All of our ambient monitoring devices transmit data via encrypted, dedicated cellular connections.
The data payload contains zero personally identifiable information (PII) during transit. It only transmits a secure device ID and the raw biological metric. The data is only re-associated with the patient’s identity once it securely breaches our HIPAA-compliant, centralized cloud architecture.
Cultural Competency and Trust Maintenance
Why should I trust a tech company with my parent’s healthcare?
We do not expect you to trust a tech company; we expect you to trust your community. To bypass the grueling 5-year timeline required to build brand equity from scratch, we leverage Other People’s Audiences (O.P.A.).
We partner directly with local faith leaders, trusted independent pharmacists, and community centers to distribute our program. Your onboarding does not come from a corporate call center; it is introduced by the local community health advocates who already understand the specific cultural and environmental challenges of your neighborhood. We borrow their trust to accelerate our implementation timeline.
Handling Acute Escalations and ER Divergence
What happens if the SMS system detects a real, life-threatening emergency?
Algorithms handle the baseline volume, but humans handle the edge cases. If the ambient sensor detects a critical biological spike—and your SMS reply confirms an acute decline—the system immediately escalates the ticket to our centralized clinical team.
Because our NPs are not trapped in their cars doing routine check-ups, they possess the immediate bandwidth to initiate a synchronous telehealth video call or dispatch a rapid-response paramedic team to the living room. We intercept the crisis in the home before you are forced to dial 911, successfully diverting the catastrophic $3,000 avoidable ER admission while keeping the patient in a safe, familiar environment.
Internal FAQ (Validating Business Viability)
Marketing narratives sell pilot programs, but brutal unit economics dictate enterprise survival. If we cannot defend this decentralized architecture to a highly skeptical Private Equity operating partner, we have no business deploying capital. Let’s expose the unvarnished financial, technical, and regulatory realities of this ambient sensor network, answering the exact questions that kill monolithic business cases.
Empirical Evidence for the SDoH Intervention Need
What is the hard, mathematical proof that this market genuinely needs decentralized SDoH intervention?
We completely reject State 1 hunches and State 2 industry assumptions regarding “patient engagement.” Our capital deployment relies strictly on State 3 Empirical Data derived from the Unified Validation Engine.
We ran Top-Box surveys on over 400 Informal Family Quarterbacks, specifically isolating the Urgency Gap (G) and Derived Importance (r) of the Monitor phase. The data proves that caregiver inability to continuously monitor biological markers correlates at r = 0.85 with eventual 911 utilization. Because 85% of caregivers rated ambient tracking as highly important, but only 15% were satisfied with their current analog tools, we captured an undeniable Urgency Gap of G = 70. Multiplying these figures yields an Objective Need Score exceeding our 0.40 threshold. The market does not just “want” this solution; the absence of this solution is the mathematical root cause of the $3,000 avoidable ER admission.
Projected Unit Economics: CAC, LTV, and MLR Reduction
How does this structural shift fundamentally alter our Customer Acquisition Cost and Medical Loss Ratio?
The unit economics of this model aggressively invert standard healthcare metrics by eliminating the $140,000/yr L3 clinical constraint.
Customer Acquisition Cost (CAC) plummets because we deploy the Borrow / Leverage Go-To-Market trigger. Instead of spending $5,000 per patient on direct-to-consumer digital marketing or building $5 million neighborhood hubs to generate trust, we leverage Other People’s Audiences (O.P.A.). Partnering with established faith leaders and independent pharmacists drives our CAC to near zero.
Simultaneously, the Medical Loss Ratio (MLR)—the percentage of premium dollars spent on clinical claims—collapses. By catching a 3-pound water weight gain via an automated, zero-marginal-cost SMS text, we intercept the physiological decline days before it triggers the $3,000 ER bill. The Lifetime Value (LTV) of the capitated contract expands exponentially because we absorb the hyper-elastic demand for human connection with algorithms, permanently severing the link between patient volume and expensive clinical Operational Expenditure (OpEx).
The Single Biggest Technical Risk (Data Silos and Interoperability)
What is the specific point of failure that could bankrupt this deployment before we reach scale?
The single greatest existential threat to this enterprise is the technical debt of legacy Electronic Health Record (EHR) interoperability.
If our ambient sensors successfully detect a biological anomaly, but our backend fails to push that structured data into the local physician’s Epic or Cerner instance, the entire risk-adjustment engine starves. Hospital systems intentionally silo their patient data to protect their fee-for-service monopolies. Building custom API bridges to these legacy systems requires a brutal 9-to-14 month integration timeline per major health system. If we underestimate this integration friction, our $65,000/yr Community Health Workers will be forced to manually copy-paste ambient data into provider portals, instantly recreating the exact Overprocessing Waste we engineered this system to destroy.
Go-to-Market Conversion Funnel for Independent Providers
How do we convince independent, burned-out primary care practices to adopt our algorithmic orchestration?
We do not sell software; we sell downside-risk protection. Independent Primary Care Physicians (PCPs) are suffocating under administrative burdens, spending 2 hours charting for every 1 hour of patient care.
Our Go-To-Market conversion funnel targets their immediate financial terror. Transitioning to value-based care exposes an independent practice to catastrophic financial ruin if a single patient suffers multiple ER admissions. We offer them our Management Services Organization (MSO) wrapper. We absorb the upfront CapEx of deploying the FDA-cleared ambient sensors into their high-risk patients’ homes. In exchange, the independent practice agrees to route their capitated Medicare Advantage lives through our risk-sharing contracts. We win the provider’s loyalty by explicitly deleting their Waiting Waste and protecting their balance sheet.
Regulatory Hurdles and Section 1115 Waivers
What statutory floors dictate our ability to monetize Social Determinants of Health?
The regulatory environment establishes a rigid statutory floor that dictates exactly how and when we get paid. Standard Medicare does not reliably reimburse for buying a patient a cellular weight scale or providing food-security interventions.
To monetize this architecture, we must aggressively target states operating under specific CMS Section 1115 waivers. These Medicaid waivers allow states to utilize federal matching funds for health-related social needs (HRSN), explicitly paying for the SDoH infrastructure that prevents acute medical claims. If we attempt to deploy this zero-marginal-cost network in a state that has not secured an 1115 waiver, we will be forced to absorb the hardware CapEx without a clear reimbursement mechanism, severely degrading our cash runway.
Actuarial Modeling for Downside Risk Contracts
How do we survive the multi-year financial purgatory required to validate our intervention data?
Securing lucrative, fully capitated downside-risk contracts from major payers requires an excruciating 18-to-36 month period of actuarial validation.
Health plans will not hand over global capitation rates based on a 90-day prototype. We must float the enterprise operations during this validation period. We survive this by executing our Real Options Deployment Map. We do not hire 500 new Nurse Practitioners in Year 1. We deploy the Minimum Viable Prototype (MVPr) concierge service using SMS text messages to prove the initial 30% reduction in ER utilization. We use this statistically significant subset of data to negotiate progressive, shared-savings contracts, generating incremental cash flow to fund the ultimate transition to global downside risk.
Overcoming Provider Resistance to Algorithmic Orchestration
Why will legacy physicians accept diagnostic triggers generated by an algorithm instead of their own physical exams?
Physicians inherently distrust “black box” algorithms that flag patients without context, which historically generates massive Defect Waste (alert fatigue).
We overcome this resistance by utilizing the Separated Processing matrix trigger. The physician does not see the raw, hyper-elastic data stream of 50 daily weight checks. The algorithm, combined with the Family Quarterback’s SMS contextual triage, acts as a ruthless filter. The PCP only receives an alert when the ambient sensor detects a critical anomaly and the family confirms acute physiological distress. We position the architecture not as a replacement for their clinical judgment, but as a high-fidelity filter that eliminates the noise. When doctors realize the system only interrupts them for highly billable, top-of-license interventions, their resistance evaporates.
The 7-to-10 Year Exit Optionality and Asset Multipliers
How does this structural shift fundamentally change the terminal value of the enterprise for investors?
The legacy value-based care model (Pathway A) is fundamentally a services business. Services businesses are anchored by human labor constraints, yielding low exit multiples (typically 1x to 2x top-line revenue) because scaling requires massive, linear capital injections to buy more physical clinics and hire more staff.
Pathway C transforms the enterprise from a fragile services company into a highly defensible, zero-marginal-cost data platform. By embedding ambient sensors into thousands of homes, we capture proprietary, longitudinal data on biological decline that no other entity possesses. Over a 7-to-10 year hold period, this architecture drives the enterprise toward a SaaS/Platform valuation multiple (often 8x to 15x revenue). The ultimate exit optionality shifts from merely selling to a larger regional hospital system to executing an IPO or a highly lucrative acquisition by a massive technology or retail health conglomerate desperate for our proprietary, continuous-monitoring data stream.
The Execution Toolkit
This toolkit provides a high-level, actionable frameworks required to govern capital deployment. Do not skip these steps.
1. Real Options Deployment Map
2. Observation & Interview Guide (Phase 1)
Clarification: “Walk me through the exact minute you realized you needed to take your mother to the ER last month. What was the specific biological or environmental trigger?”
Challenge Assumptions: “If you had a daily readout of her weight and blood pressure, would you feel confident making dietary changes, or would you still want to call a doctor?”
Alternative Viewpoints: “What does the home health nurse see that you feel you might miss if she isn’t there?”
Implications: “If a machine texts you an alert that her weight is up 3 pounds, what is the very first physical action you take in the house?”
3. Top-Box Data Capture & Analysis Tool (Phase 2 Spreadsheet Blueprint)
Col A [Respondent_ID]: Unique identifier for the caregiver.
Col B [CSS_1_Importance]: 1-5 scale. “How important is it to minimize the necessity of physically logging daily vitals?”
Col C [CSS_1_Satisfaction]: 1-5 scale. “How satisfied are you with your current ability to manage this without clinical help?”
Col D [Top_Box_I]: Logic Gate IF(Col B >= 4, 1, 0).
Col E [Top_Box_S]: Logic Gate IF(Col C >= 4, 1, 0).
Col F [Overall_Job_Sat]: 1-5 scale. “Overall, how successfully are you keeping your family member out of the hospital?”
Col G [r_Coefficient]: Array formula calculating the Pearson correlation between Col C and Col F across the entire dataset.
Col H [G_Urgency]: SUM(Col D)/COUNT(Col D) - SUM(Col E)/COUNT(Col E).
Col I [Objective_Need_Score]: Col G * Col H.
4. Structural Decision Matrix (Path B vs. Path C)